Changing column position
In a table visual, you can change the position of a column for better visualization of data in CDP Data Visualization.
By default, measure columns appear after all the dimension columns. In a table with large number of dimensions, it may be difficult to analyse the data if measure columns appear towards the end of the table.
Let's take an example of the cereal data and demonstrate how changing the position of the column improves the analyis of data.
To change the position of a column in a table, follow these steps:
- Click the measure that you plan to move to open the Field
Properties menu.
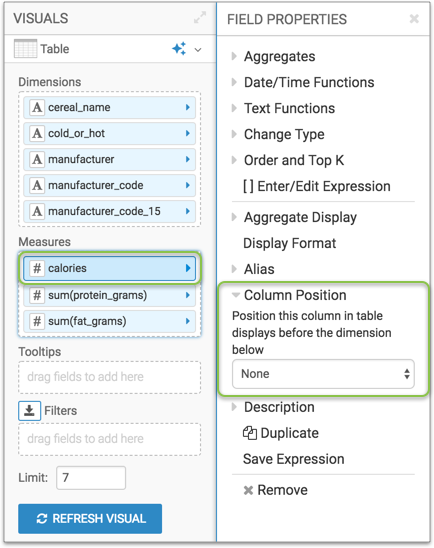
In this example, we are moving calories.
- Under Field Properties, click to expland the
Column Position menu.

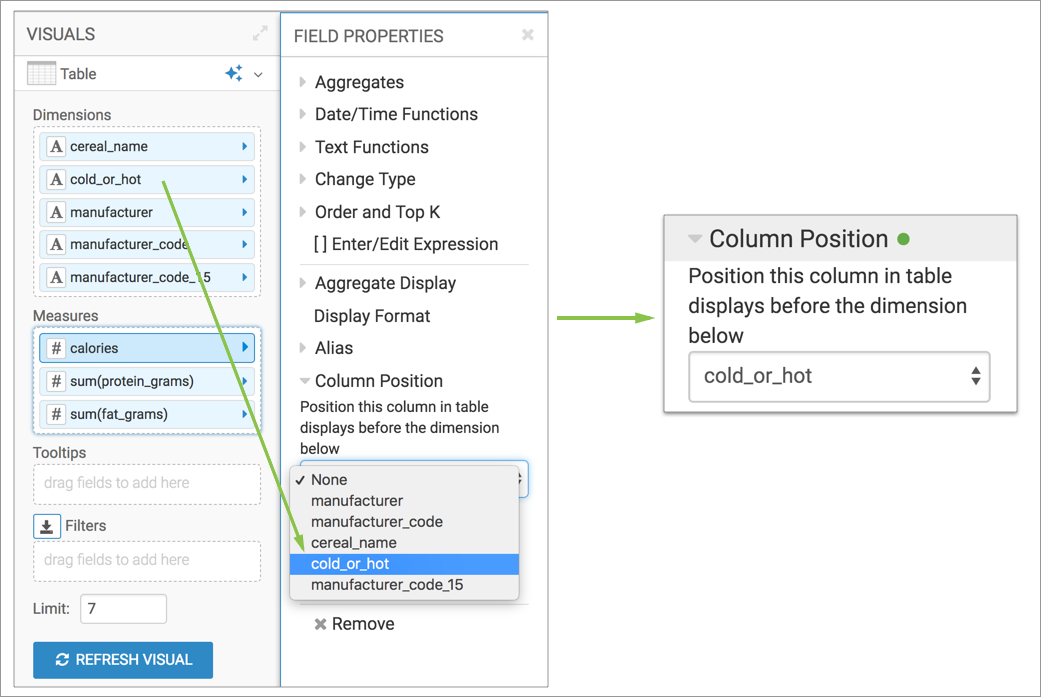
- From the list of dimensions in the dropdown menu, select
cold_or_hot.A green dot appears beside the field indicating a change in the value.

- Click Refresh Visual to see the changes.
Notice in the first image, calories column appears after all the dimension columns. However, if you want to compare the calories in each cereal, by moving the calories column before the cold_or_hot. column (second image), it becomes easier to view that data.


