CDP Data Visualization enables you to insert tables in Rich text visuals.
In the Rich-Text Editor,
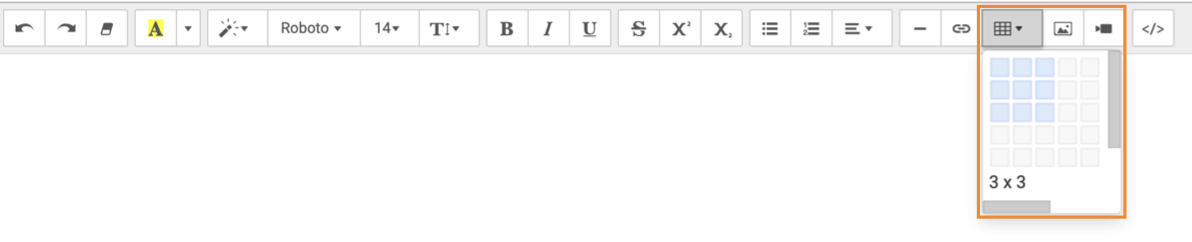
click the Table icon and select the number of rows/columns for the new
table.The table is automatically added to your visual.
We want your opinion
How can we improve this page?
What kind of feedback do you have?
This site uses cookies and related technologies, as described in our privacy policy, for purposes that may include site operation, analytics, enhanced user experience, or advertising. You may choose to consent to our use of these technologies, or