Filtering data using legends
With large datasets, a visual may become very crowded, making it hard to understand what graphical elements represent. In Cloudera Data Visualization, you can easily filter on a particular element in the legend.
Data Vizualization legends are interactive. In View mode, you can easily find an element, by either hovering over an element, or by clicking to filter on a particular element. See Making Visuals Interactive with Legends.
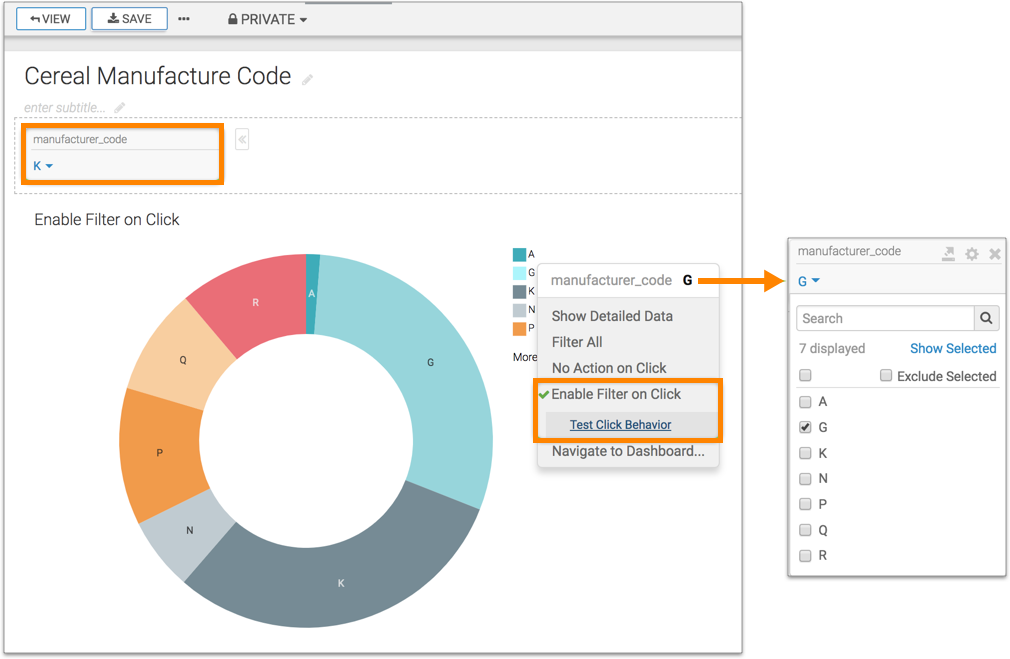
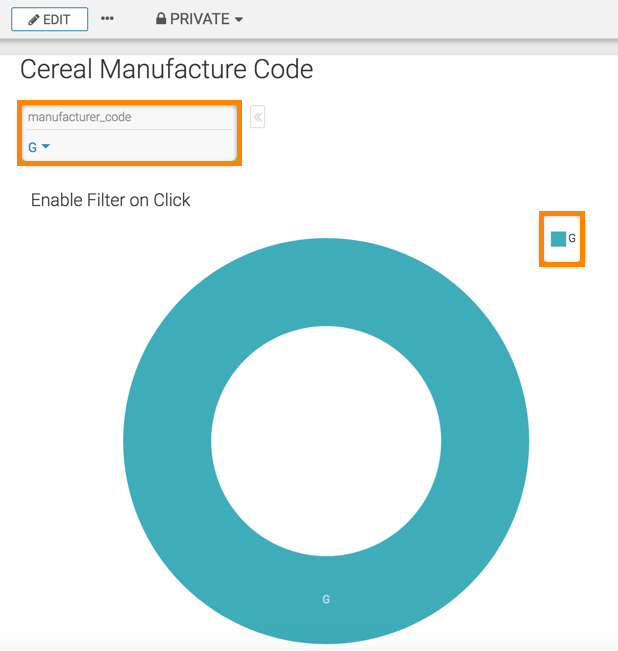
In dashboard Edit mode, you can filter on a particular element in the legend. You can also test the behavior of the filter before viewing the filter results in View mode.
The following procedure shows you how to filter a visual from a legend.


