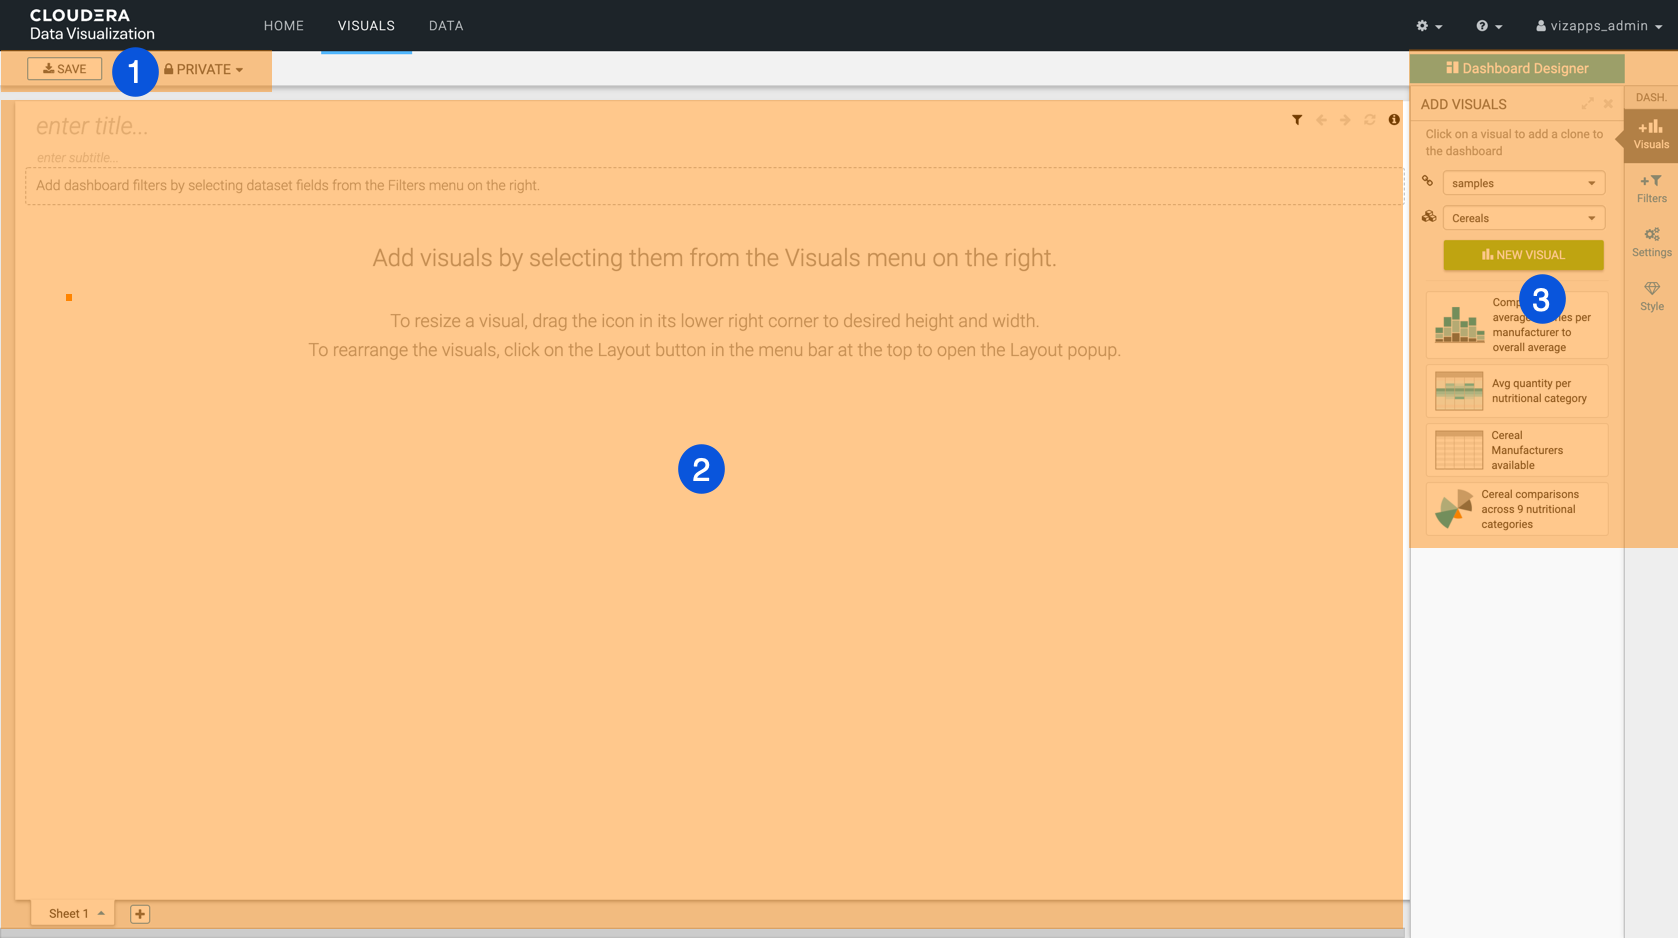
The Dashboard Designer of CDP Data Visualization is an intuitive
interface for building dashboards that help you to collect, organize, and display related
visuals. You can add or link the visuals you have created based on datasets from the same
connection or across different connections.
The Dashboard Designer page has the following main parts:
Dashboard Designer top menu bar
Dashboard preview area
Dashboard Designer side menu bar
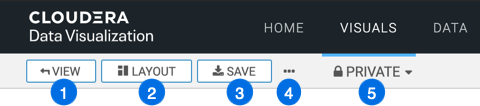
Dashboard Designer top menu bar🔗
The VIEW button allows you to preview the dashboard at runtime.
It is only displayed on the menu bar if you already saved your dashboard.
The LAYOUT button allows you to edit the layout of dashboard
visuals. It is only displayed on the menu bar if you already saved your dashboard.
The SAVE button saves all changes to the dashboard.
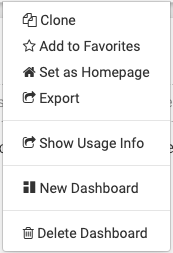
The Supplemental menu provides access to additional
functions:
Clone lets you clone the current dashboard.
Add to Favorites lets you mark commonly-used dashboards as
favorites and quickly find them in a subsequent work session. This menu item is only
available after you first saved your dashboard.
Set as Homepage lets you change your home screen to the
current dashboard. This menu item is only available after you saved your
dashboard.
Export allows you to export all of the dashboard elements.
This menu item is only available after you saved your dashboard.
Download as... provides you with options to save your
dashboards as images (in png format) and as PDF files.
Show Usage Info provides you with profile data. For more
information, see Showing usage information.
New Dashboard lets you create a new dashboard.
Delete Dashboard lets you remove the current dashboard.
The workspace selector allows you to assign your dashboard to a different workspace.
Dashboards can belong to public, private, or a custom workspace, but they can only exist
in one workspace at any time.
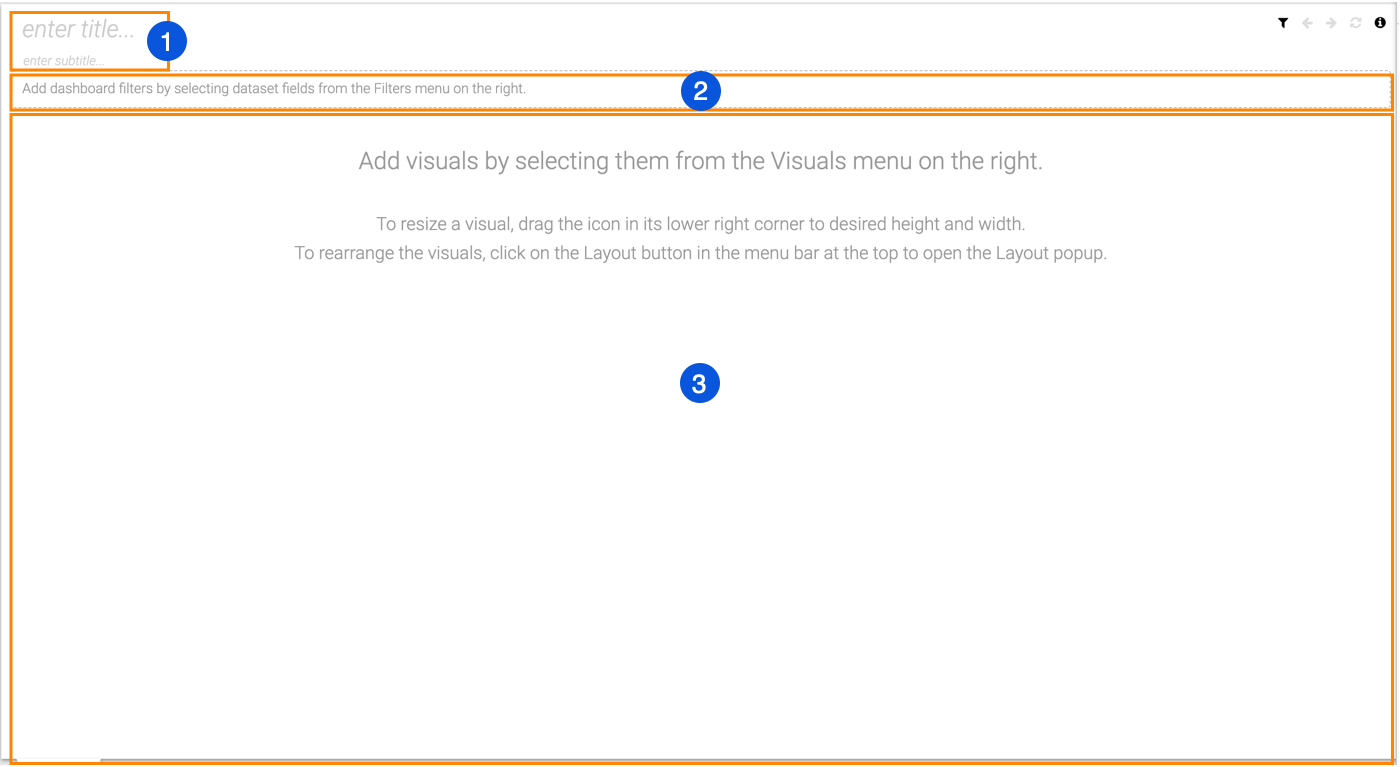
Dashboard preview area🔗
The dashboard preview area shows the contents of the dashboard, that is all filters and
visuals you have added to it. You can also find here the title and subtitle of the
dashboard. When you start building a new dashboard, this area is empty.
The title area contains two editable fields where you can add the title and subtitle of
your choice. Both are empty when you create a new dashboard.
enter title...
enter subtitle...
The filter area contains the filter controls that allow you to dynamically change the
dashboard presentation at run time. Filters can be defined on any column of the dataset by
pulling the appropriate field from the Filters menu.
The visuals area contains the visuals of the dashboard. To add visuals here, you can
select them in the Visuals menu.
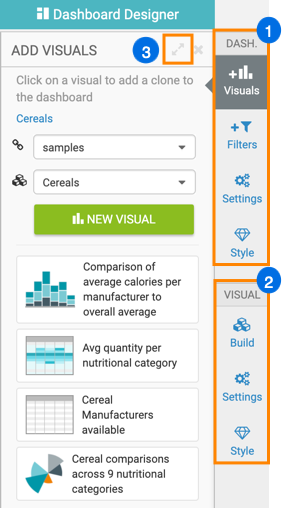
Dashboard Designer side menu bar🔗
The dashboard menu selector enables you to choose between
different menus in the Dashboard Designer.
Visuals – This menu allows you to add visuals to your
dashboard.
Recently Created Visuals show you the new visuals added
recently.
The Connection drop-down list lets you select an
alternate connection. It is available in both the Visuals
and Filters menus.
The Dataset drop-down list lets you select an alternate
dataset. It is available in both Visuals and
Filters menus.
The NEW VISUAL button enables you to start a new visual
from within the dashboard.
Existing visuals that belong to the specified dataset are displayed lower on the
menu. Changing the dataset gives access to other visuals. You can click the
visuals to add them to the dashboard.
Filters – This menu allows you to add filters to your
dashboard.
The CREATE CUSTOM FILTER button allows you to create a
custom filter based on any parameter and add it to your dashboard.
The Connection drop-down list lets you select an
alternate connection. It is available in both Visuals and Filters menus.
The Dataset drop-down list lets you select an alternate
dataset. It is available in both Visuals and
Filters menus.
Dimensions show you all fields by dataset that you can
use as a filter.
Measures show you all fields by dataset that you can use
as a filter.
Settings – This menu provides you with several options for
dashboard display settings.
General
Filter Settings
Downloads
See Customizing general settings for dashboards for more
information.
Style – This menu provides you with various styling options
for dashboards.
Dashboard Basics
Dashboard Title
Dashboard Subtitle
Filters
Visual Borders
Custom Style
See Customizing style for dashboards for more information.
If you already have a visual or visuals available in the dashboard and you are working
on one of them, you can also see the visual menu selector in the
side menu bar. It enables you to choose between different menus in the Visual
Builder.
Build
Settings
Style
For more information about these visual menu options, see Visual
Builder.
At the top right corner of the Dashboard Designer side menu, you
can click the [expand] iconto increase its width. To decrease the
size of the pane, you can click the [compress] icon.
We want your opinion
How can we improve this page?
What kind of feedback do you have?
This site uses cookies and related technologies, as described in our privacy policy, for purposes that may include site operation, analytics, enhanced user experience, or advertising. You may choose to consent to our use of these technologies, or