
Enabling gridlines
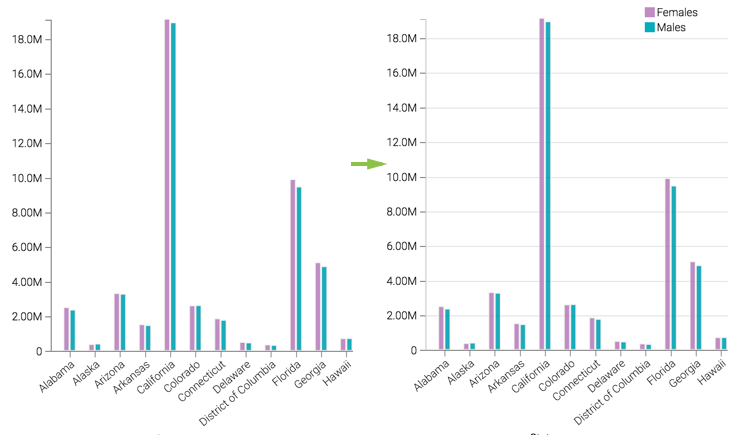
To enable gridlines for a visual that uses an X and Y Axes, navigate to the Axes menu, and select Gridlines Enabled.

Notice that the appearance of gridlines helps to more accurately approximate the values of the aggregates.
To enable gridlines for a visual that uses an X and Y Axes, navigate to the Axes menu, and select Gridlines Enabled.
Notice that the appearance of gridlines helps to more accurately approximate the values of the aggregates.
What kind of feedback do you have?
