Downloading visual data to Excel file
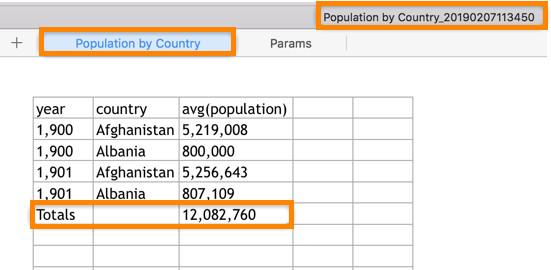
CDP Data Visualization enables you to save data in your visuals as an Excel file. The filename is the same as the name of the visual, and has a timestamp specifying the date and time when the file is created.
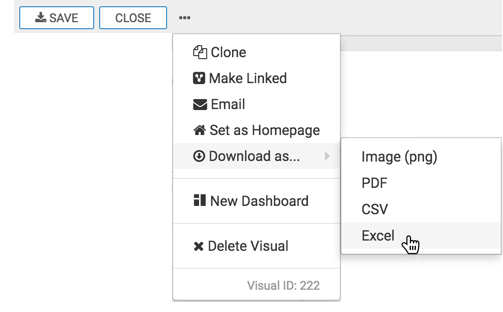
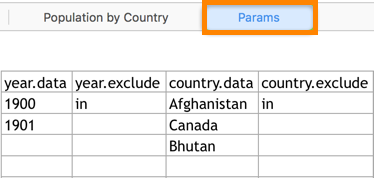
Excel download is available on all visuals. In the following example, we demonstrate how to download visual data to an Excel file. The resulting Excel worksheet also contains a separate sheet showing parameter definitions.
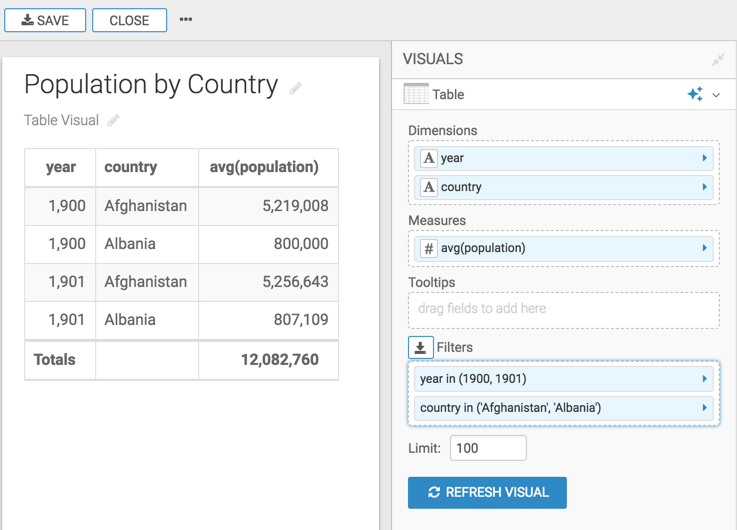
The example uses a table visual with two filters. Year in 1900, 1901 and country in Afghanistan and Albania. To show totals in the visual, enable Showing column totals.

Before you begin to download a CSV file, you must Enable CSV Download. `The site administrator can override this setting in the Enable "Download as CSV/Excel" by default in the Site Settings interface. See Downloading maximum number of rows in CSV files.


