Changing the map server for interactive maps

CDP Data Visualization uses two third-party options for its Interactive Map visuals: Google and Mapbox.

The Map Server setting is used to specify the mapping choice.

The following steps demonstrate how to switch between Google and Mapbox interactive map representation.

  1. Clone the visual previously built in Interactive maps.

    For instructions, see Cloning visuals.

  2. Follow the instructions in Changing the map server to switch between Google and Mapbox map styles.
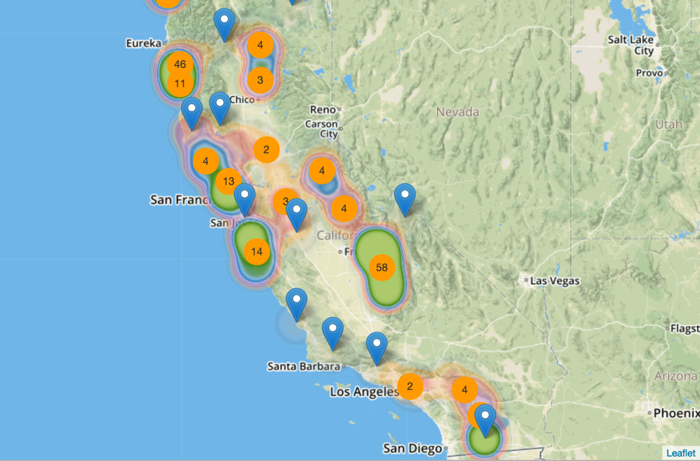
  3. Click REFRESH VISUAL to see the map rendered with Mapbox option.
    See the Mapbox documentation for more details.
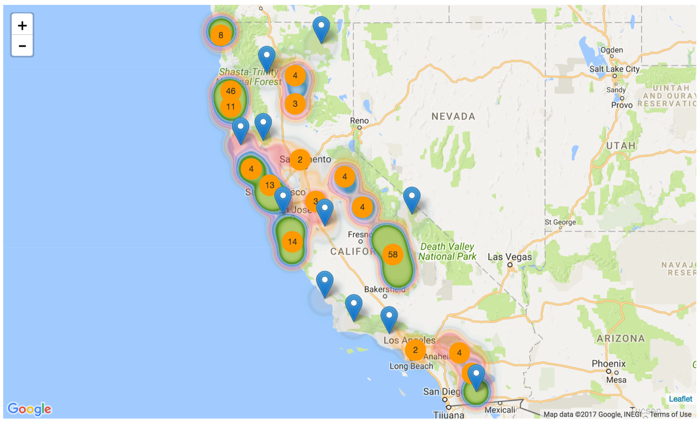
  4. Compare with the similar map rendered on a Google INEGI map.
  5. Click the pencil/edit icon next to the title of the visualization to enter a name for the visual.

    In this example, the title is changed to 'California Woods - Mapbox'. You can also add a brief description of the visual as a subtitle below the title of the visualization.

  6. At the top left corner of the Dashboard Designer, click SAVE.