
Adjusting table column width
In CDP Data Visualization, you can manually adjust, either increase or decrease, the width of columns in a table.
- In the table header, hover your cursor on the right side of the column border until the [cross-hairs] icon appears.
- Click column border, drag it the to the desired width, and then release the cursor.
In this example the width of a column in a table is increased.
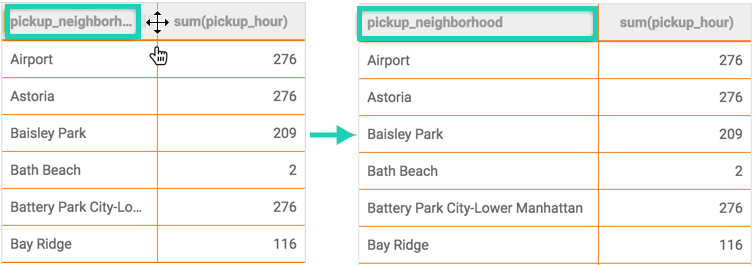
When the column width is smaller than the length of the text in the cell, the text is abbreviated, and a series of three dots (ellipsis – …) appear at the end of the line. The first column heading text of the left visual is displayed as 'pickup_neighborh...'. In such cases, you can hover over the table cell to see the full text.
