Homepage
/
Data Visualization
6
Search Documentation
▶︎
Cloudera
Reference Architectures
▶︎
Cloudera on cloud
Getting Started
Patterns
Preview Features
Data Catalog
Data Engineering
Data Flow
Data Hub
Data Warehouse
Data Warehouse Runtime
Cloudera AI
Management Console
Operational Database
Replication Manager
DataFlow for Data Hub
Runtime
▶︎
Cloudera on premises
Data Services
Getting Started
Cloudera Manager
Management Console
Replication Manager
Data Catalog
Data Engineering
Data Warehouse
Data Warehouse Runtime
Cloudera AI
Base
Getting Started
Runtime
Upgrade
Storage
Flow Management
Streaming Analytics
Flow Management Operator
Streaming Analytics Operator
Streams Messaging Operator
▶︎
Cloudera Manager
Cloudera Manager
▼
Applications
Cloudera Streaming Community Edition
Data Science Workbench
Data Visualization
Edge Management
Observability SaaS
Observability on premises
Workload XM On-Prem
▶︎
Legacy
Cloudera Enterprise
Flow Management
Stream Processing
HDP
HDF
Streams Messaging Manager
Streams Replication Manager
▶︎
Cloudera Streaming Community Edition
Data Science Workbench
Data Visualization
Edge Management
Observability SaaS
Observability on premises
Workload XM On-Prem
«
Filter topics
«
Hiding data and subtotal rows
Creating a visual
Cloning a visual
Linking visuals
Unlinking visuals
Emailing a visual
Exporting a visual
Importing a visual
▶︎
Downloading visuals
Downloading a visual as PNG file
Downloading a visual as PDF file
Downloading visual data to CSV file
Downloading visual data to Excel file
Removing a visual
Deleting a visual
Adding filters to a visual
Exploring visual options
▼
Visual type catalog
▶︎
Table
Shelves for tables
▶︎
Saving tables
Saving a table as a materialized table
Saving a table as a logical view
Saving a table as a dataset based on the query
▼
Cross tabulation
▼
Displaying totals with data expansion
Configuring a cross tabulation visual for expansion
Displaying subtotals and totals
Hiding data and subtotal rows
Shelves for cross tabulation
▶︎
Bars
Filtering by year
Filtering by region
Horizontal bars
Stacked bars
Labelled bars
Shelves for bars
▶︎
Lines
Lines with dual axes
Shelves for lines
▶︎
Combined bar/line visuals
Creating basic combos
Using secondary axis
Change line to area
Shelves for combos
▶︎
Areas
Using trellis option with areas
Using trellis option with independent scale
Shelves for areas
▶︎
Grouped bars
Shelves for grouped bars
▶︎
KPI
Shelves for KPIs
▶︎
Gauge
Shelves for gauges
▶︎
Row listing
Shelves for row listing visuals
▶︎
Bullet
Shelves for bullets
▶︎
Box plot
Shelves for box plots
▶︎
Packed bubbles
Shelves for packed bubbles
▶︎
Word cloud
Trellised word clouds
Shelves for word clouds
▶︎
Scatter
Basic scatter
Adding size
Adding transition animation
Adding trellis
Shelves for scatters
▶︎
Pie
Shelves for pies
▶︎
Radial
Trellised radial
Shelves for radials
▶︎
Chord
Shelves for chords
▶︎
Network
Shelves for networks
▶︎
Advanced options for networks
Same source and target data values
Link color menu
Link color shelf
Link width shelf
Link legend
Node size shelves
Nodes color menu
Node color shelves
Node legend
▶︎
Dendrograms
Shelves for dendrograms
▶︎
Treemap
Shelves for treemaps
▶︎
Correlation heatmap
Shelves for correlation heatmaps
▶︎
Correlation flow
Shelves for correlation flows
▶︎
Calendar heatmaps
Shelves for calendar heatmaps
▶︎
Maps
Choropleth country map
Country map, bubbles
State map, choropleth
State map, bubbles
County map, choropleth
County map, bubbles
Zipcode map, bubbles
Lat/long map, bubbles
Choropleth DMA map
Province map, choropleth
Province map, bubbles
Choropleth Canadian postal code map
Canadian postal code map, bubbles
Shelves for maps
▶︎
Interactive maps
Basic interactive map
Choropleth interactive maps
Interactive maps, multiple dimensions
Interactive maps, multiple measures
Changing the map server
Changing layer options
Plotting routes
Using alphabetic values
Segmenting data qualitatively
Shelves for interactive maps
▶︎
Sparklines
Using sparklines
Shelves for sparklines
Action
Search
▶︎
Timeline
Shelves for timelines
▶︎
External link visuals
Setting up dynamic external links
Shelves for external links
▶︎
Histograms
Bucket count
Normalized histograms
Cumulative option
Shelves for histograms
▶︎
Extensions
Examples of extensions
▶︎
Rich texts
Inserting URL links
Inserting tables
Inserting images from local machine
Inserting images from static assets
Resizing images
Inserting videos
Field statistics
SQL queries
»
howto visuals
Hiding data and subtotal rows
To hide the expanded rows and subtotals, follow these steps.
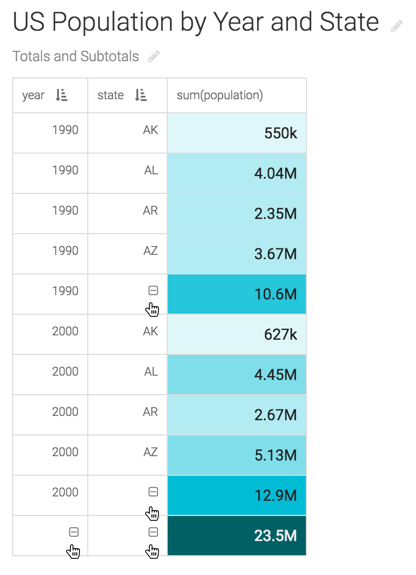
Click the
- (minus)
icon in the
year
and
state
columns.
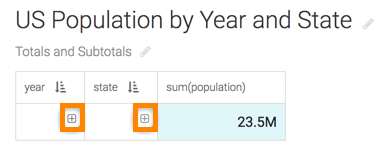
The expanded rows and subtotals no longer appear in the visual. Note that a
(plus)
icon appears again in the
year
and
state
columns.
Parent topic:
Displaying totals with data expansion
Feedback
We want your opinion
How can we improve this page?
What kind of feedback do you have?
I like something
I have an idea
Something's not working
Can we contact you for follow-up on this?
Back
Submit
OK
8
7
6