Choropleth interactive maps
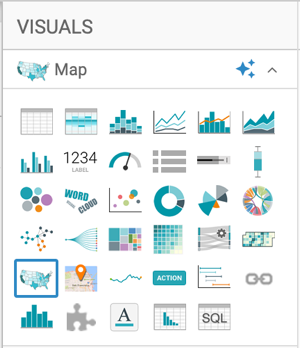
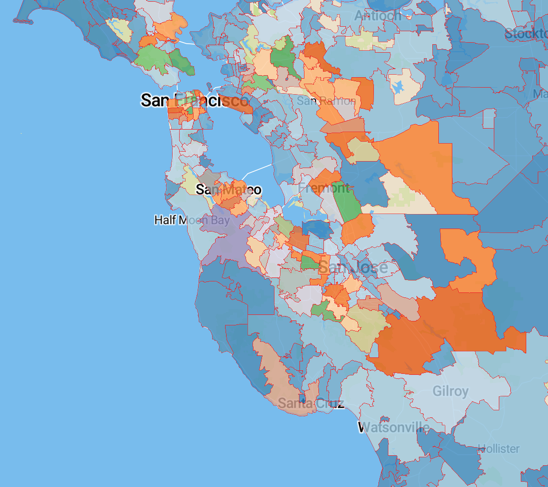
In an Interactive Map visual, CDP Data Visualization enables you to create choropleth maps. A choropleth map shows geographical areas that are shaded in proportion to the value of the measurement that is displayed on the map.
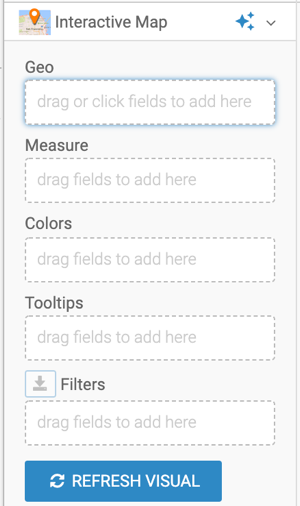
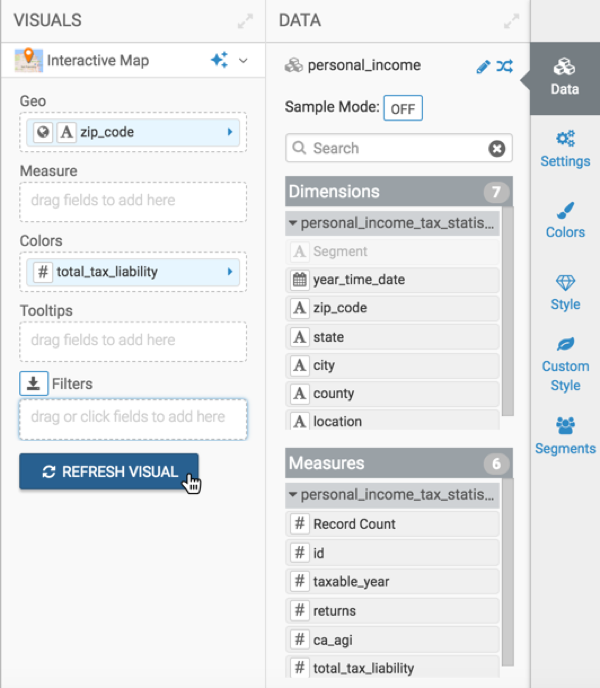
In this example, you will create a choropleth map that colors the average tax liability in California by zip code. The choropleth Interactive Map visual is based on the Personal Income Tax Statistics by Zip Code dataset. For an overview of shelves that specify this visual, see Shelves for interactive maps.
To create a choropleth map, you must specify the following for each visual:
- Custom mapbox style, which has a choropleth shape file in it. For more information, see Adding a custom mapbox style.
- Layer ID, which is the name of a unique layer within the Custom Mapbox style that identifies the shapes that you would like to color by a measure in your data. For more information, see Specifying a choropleth layeer ID.
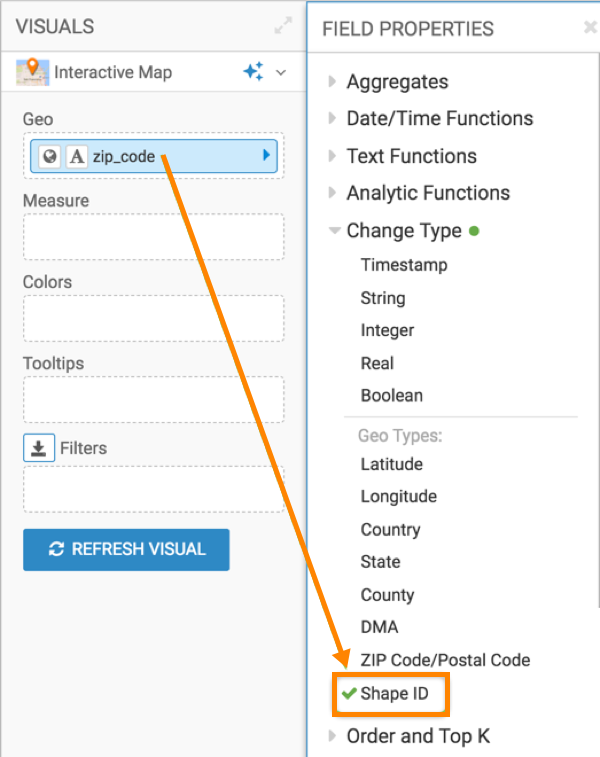
- Geo-type as Shape ID: The dataset must have at least one field in the Geo shelf to determine the location on the map. You must change the Geo-type to Shape ID. A Shape ID is a key that joins the shapes in the Custom mapbox style and the field in the Data Visualization dataset. This helps in identifying the measure that maps to the shape. This Geo field must be in the dataset that was used to create the custom mapbox style.
Proceed to Customizing the choropleth map.

