
Changing the min/max of the aggregate scale
By default, the aggregate scale starts at zero, and rises to a number just higher than the maximum aggregate value. This can be adjusted, which is useful in dashboards that contain side-by-side visuals for different segments, time periods, and so on.
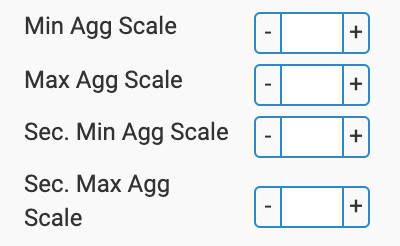
To change the minimum and maximum aggregate scale values, navigate to the Axes menu, and make adjustments to the four selectors:
- Min Agg Scale, for the Primary Axis
- Max Agg Scale, for the Primary Axis
- Sec. Min Agg Scale, for the Secondary Axis
- Sec. Max Agg Scale, for the Secondary Axis
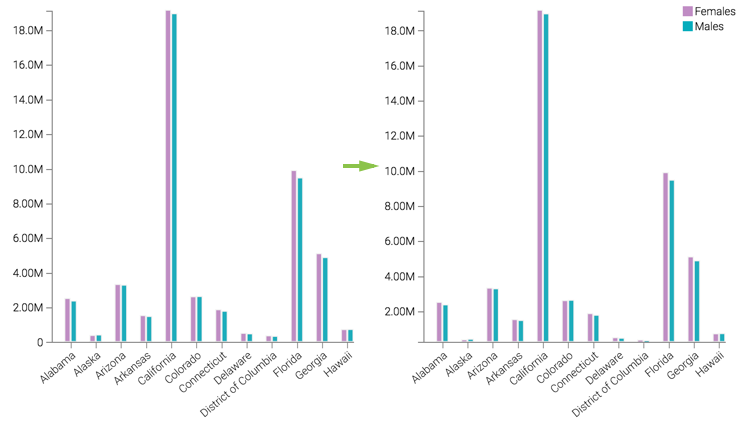
For example, raising the Minimum aggregate scale value to 250,000 has the effect of shrinking the values for the smaller aggregates.
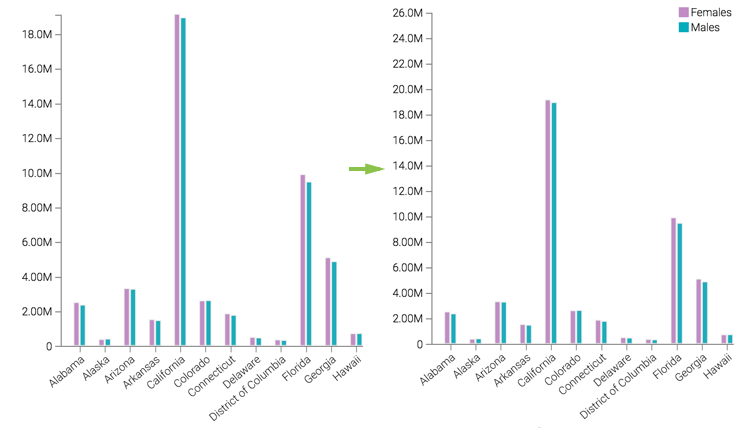
Meanwhile, raising the Maximum aggregate scale value to 26 Million adds blank space over the top aggregate, and scales the whole graph down.
Note that the minimum cannot be larger than the smallest aggregate, and the maximum cannot be smaller than the largest aggregate.
