Changing circle radius range
In an interactive map visual, CDP Data Visualization enables you to change the size of circles.
- On the right side of Visual Designer, click the
Settings menu.
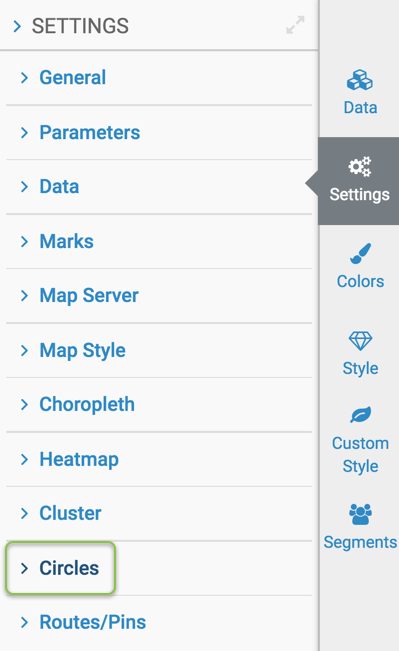
- In the Settings menu, click
Circles.
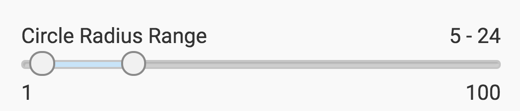
- To change the range of sizes for Circles, adjust the minimum
and maximum values in the Circle Radius Range option. This default minimum is
1, and the default maximum is 100. Valid values are between these two
numbers.
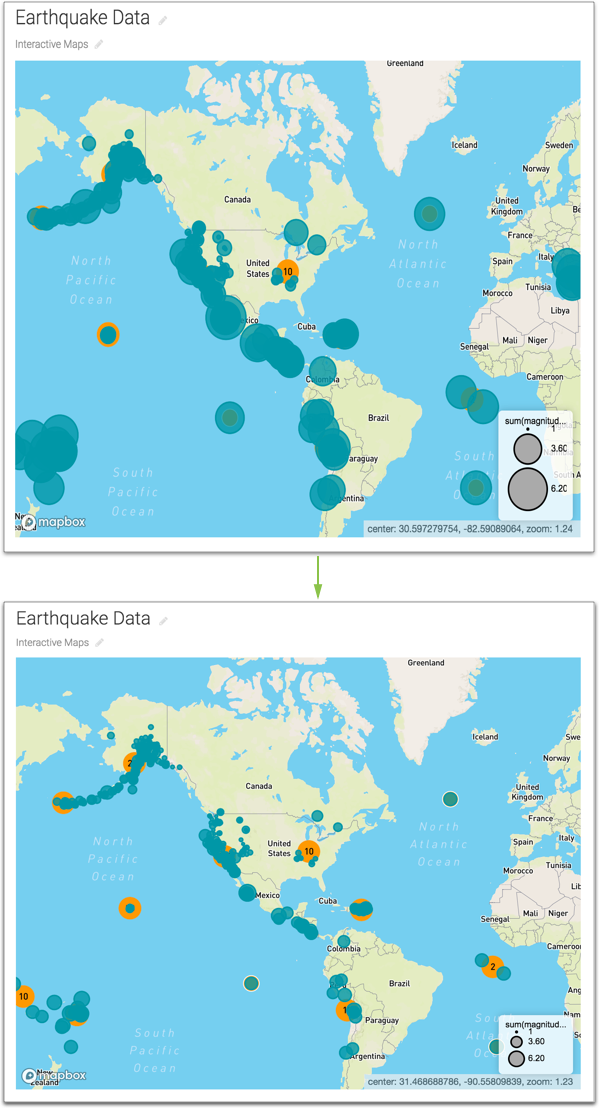
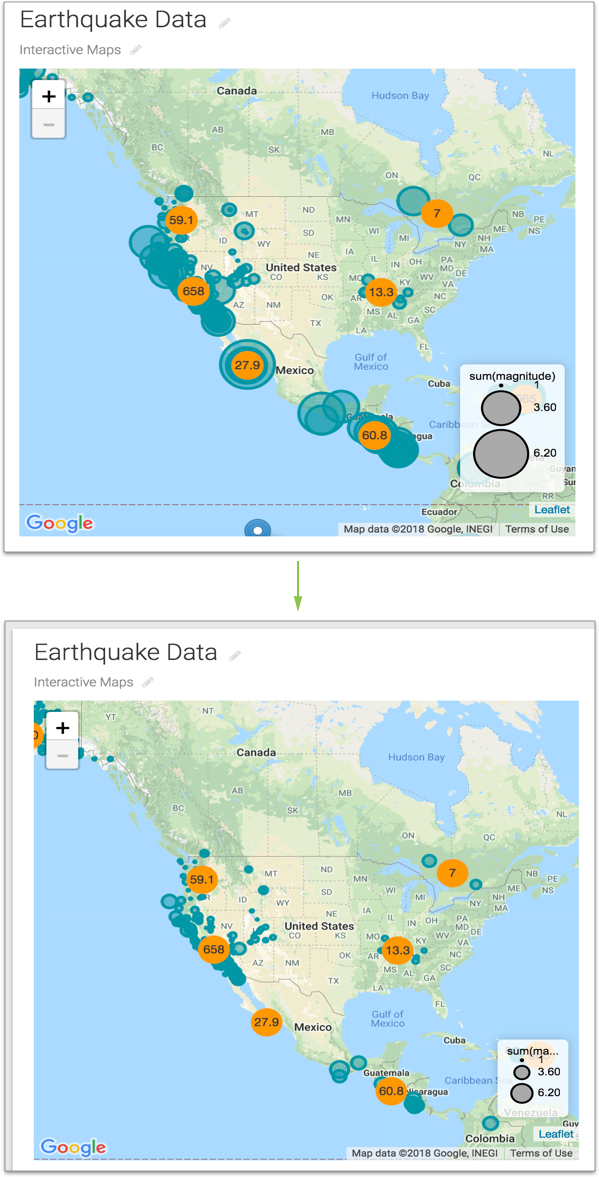
On this Google Map with Circles, contrast the maximum size setting of circles from 24, to the new maximum setting of 5.
On this Mapbox with Circles, contrast the maximum size setting of circles from 24, to the new maximum setting of 5.