Displaying axis ticks
This task applies to Gauge charts.
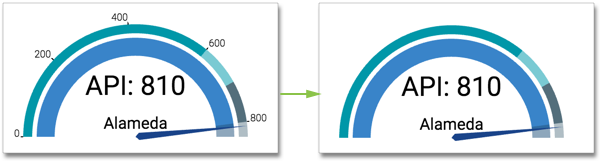
By default, the axis wraps around the outer arc of a gauge chart, and shows measurements as evenly-spaced tick marks. To hide the tick-marks, navigate to the Marks menu, and de-select the Display axis ticks option.

Note how hiding axis ticks changes the visual.