Configuring ranges on dashboard filters
In CDP Data Visualization, you can easily configure real-time filters that enable you to navigate across visuals built on time series. Both historical data and ongoing data feeds are supported.
This example uses a dashboard with a line visual that plots stock prices and volume of sales. The filter added uses a set of previously defined dateranges, as described in Managing custom dates.
Follow these steps to add and configure a real-time filter on a dashboard:
-
In the Filters menu, under Dimensions,
click the Date field.
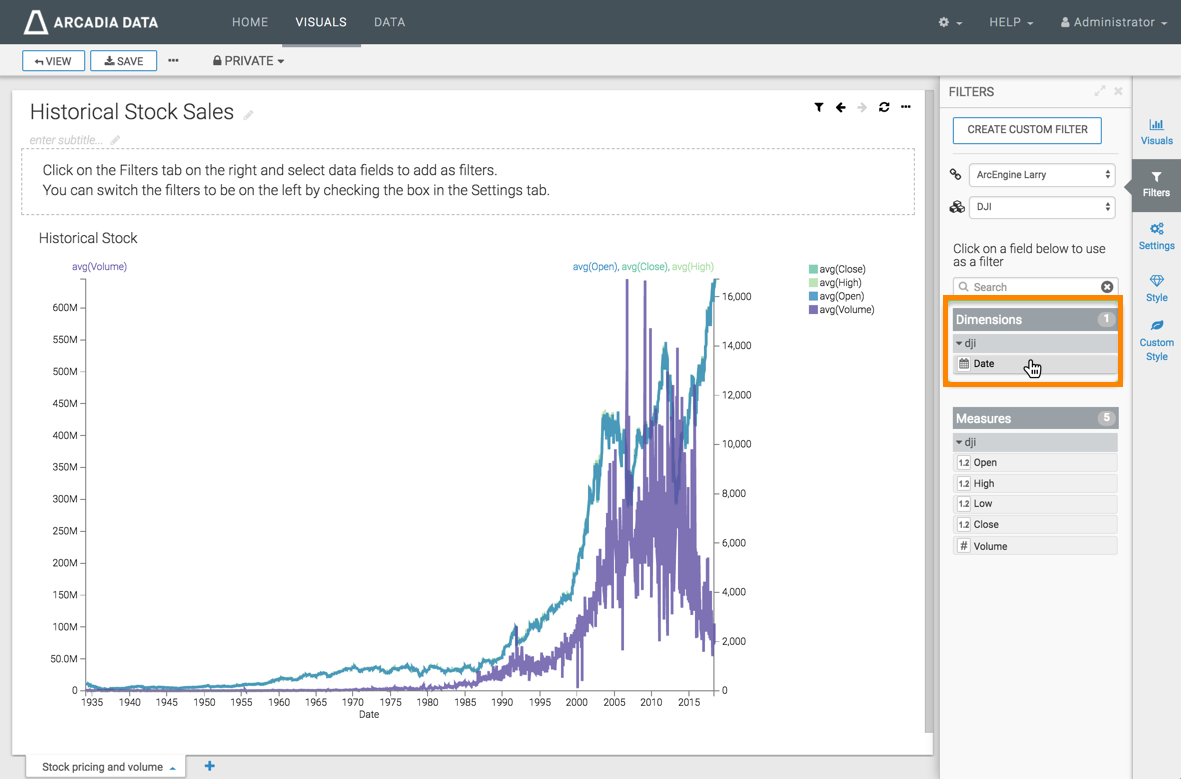
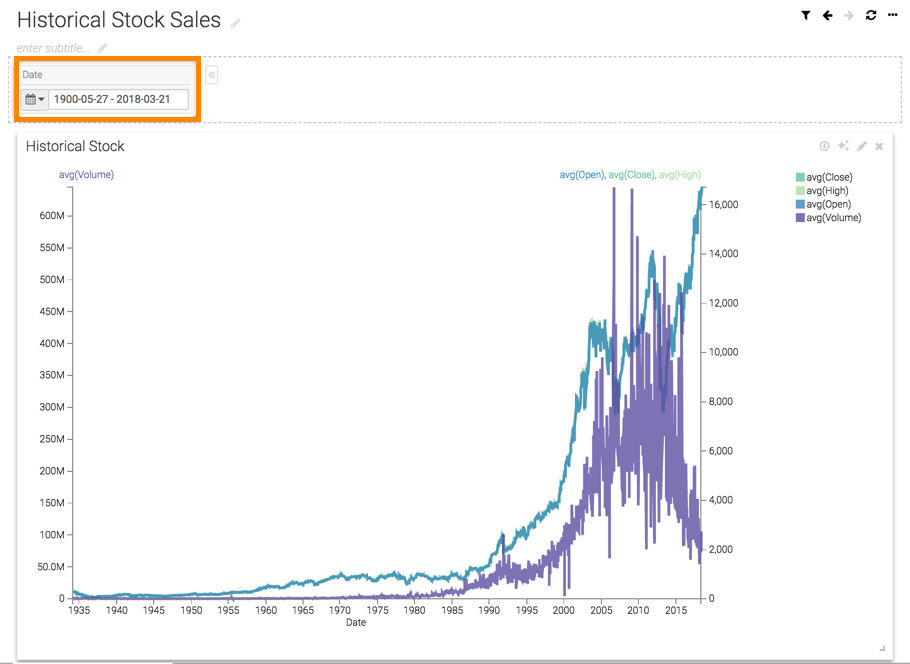
CDP Data Visualization adds the filter Date to the filters section of the dashboard.
-
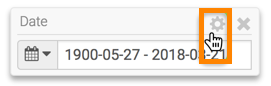
Hover over the upper right corner of the filter, and click the
Gear icon to configure the filter.
-
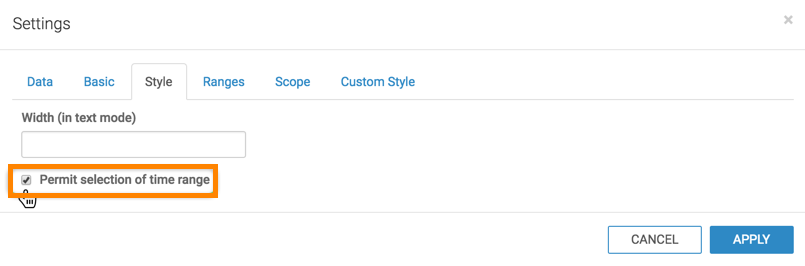
In the Settings modal window, click the
Style tab, and select the option Permit selection of
time range.
-
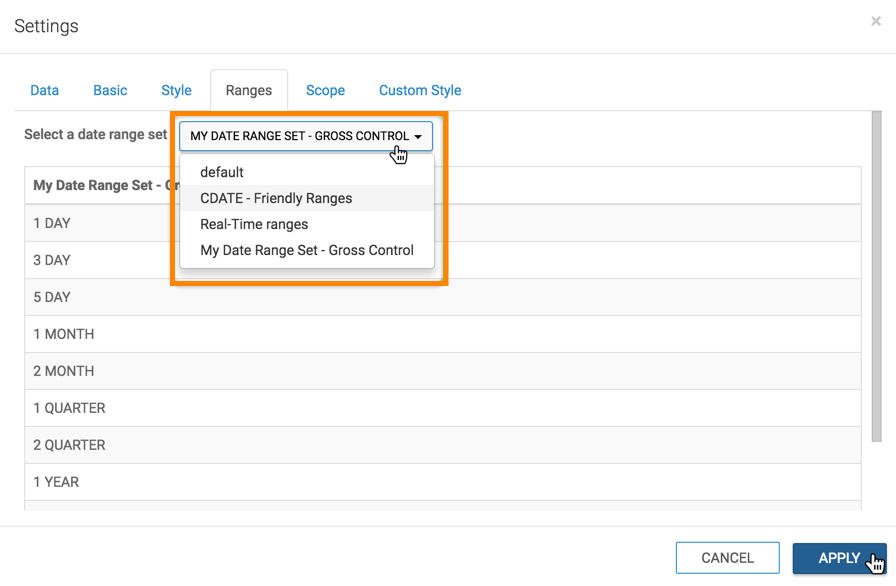
In the Settings modal window, click the
Ranges tab, and select the set My Data Range Set - Gross
Control.
-
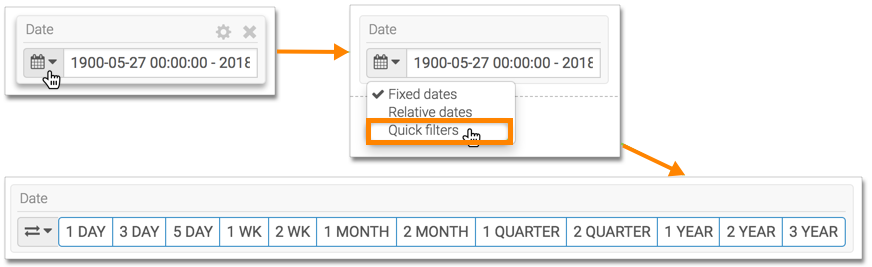
On the filter, click the Calendar icon, and select the
Quick filters option from the menu.
The appearance of the filter changes, to show the set of custom dateranges.