Creating a dashboard
In CDP Data Visualization, you can easily create a new dashboard.
- Optional:
Change the connection and/or dataset.
Even though the dashboard is automatically connected to the parent connection and dataset, you can add visuals and filters based on other connections and datasets.
-
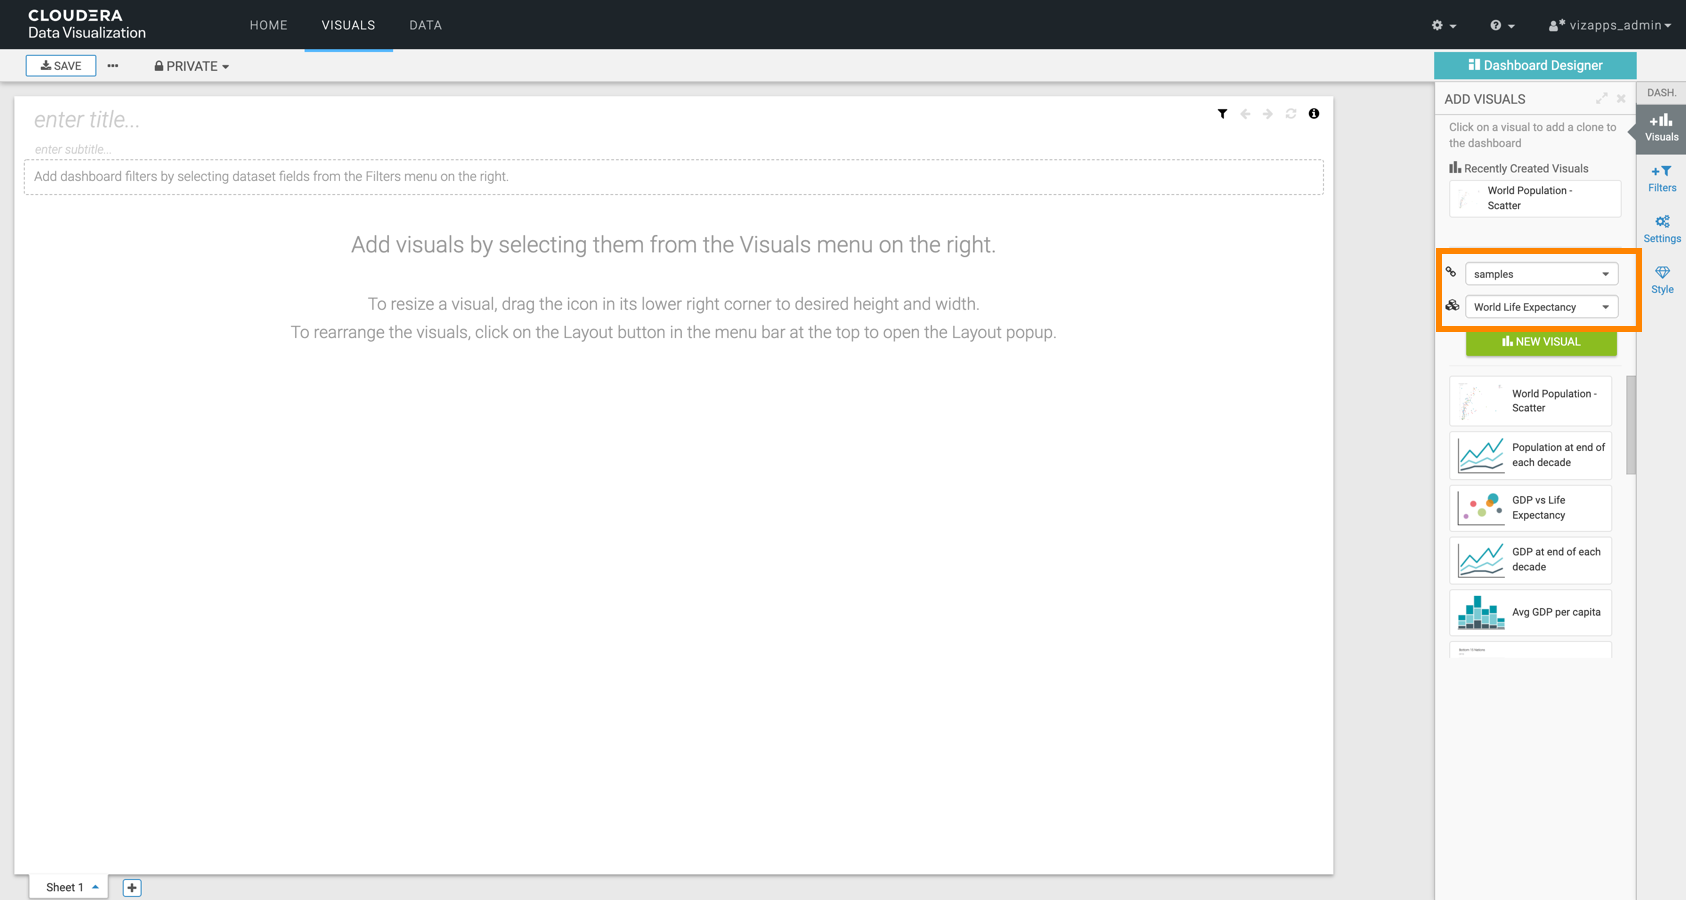
In the VISUALS menu, select the existing visual(s) you
want to add to the dashboard, either from Recently Viewed
Visuals, or from the listed visuals of this dataset.
Alternatively, you can create a new visual by clicking NEW
VISUAL.
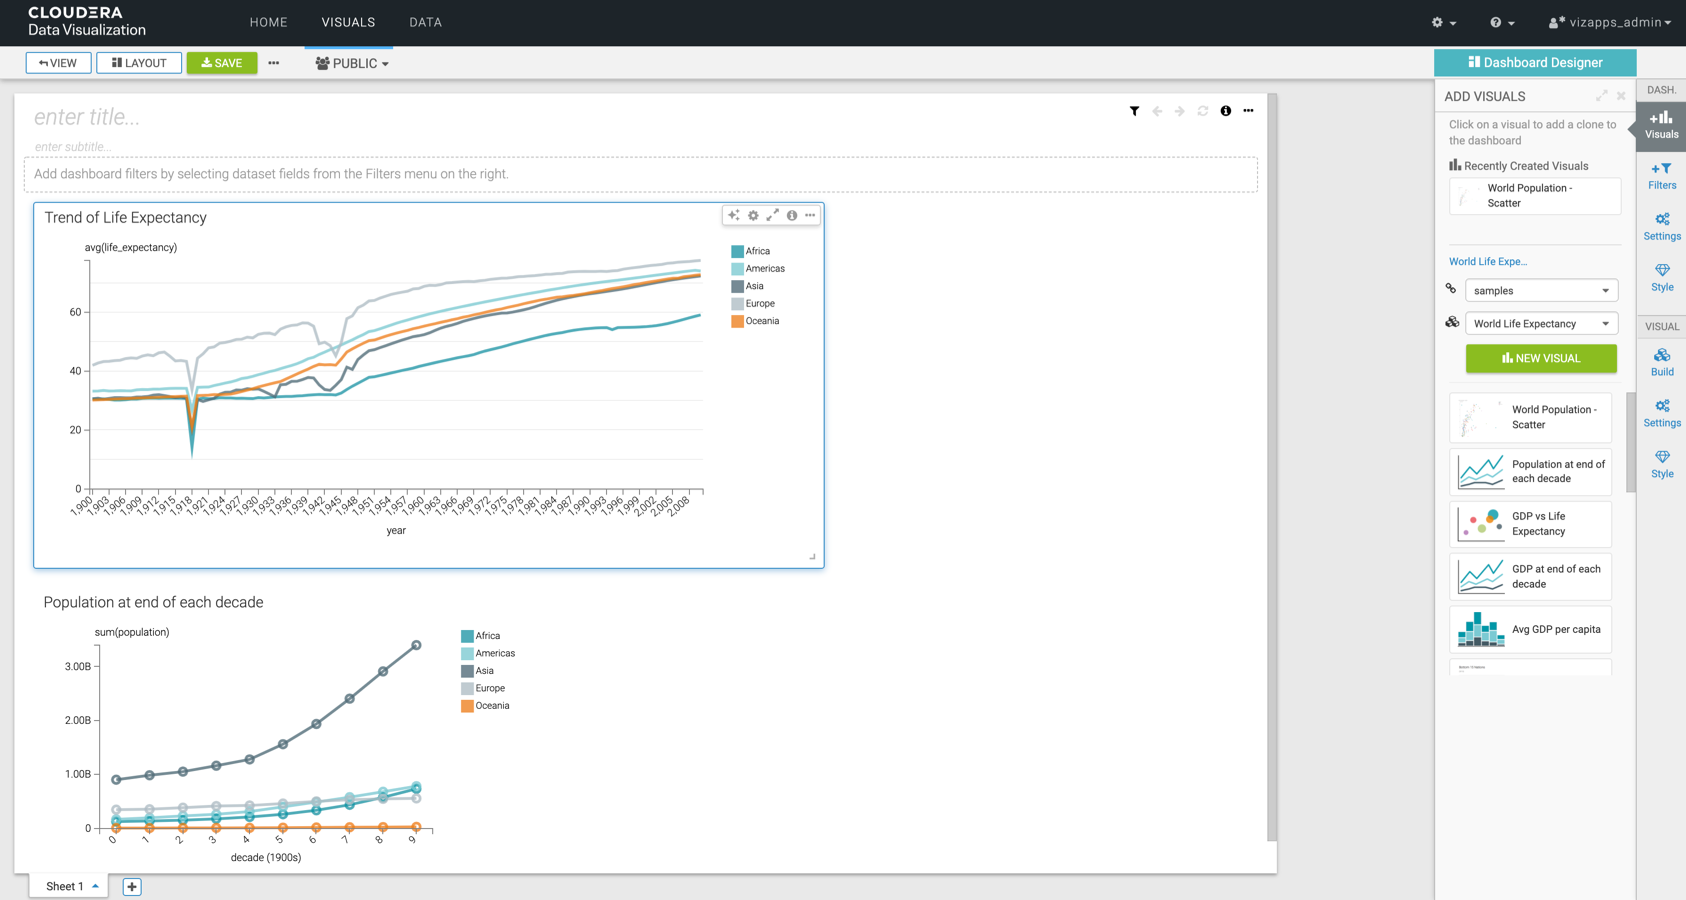
In this example, the Trend of Life Expectancy and Population at end of each decade visuals are used.
-
Click the Filters menu, and click the relevant fields to
add filters to your dashboard.
Alternatively, you can click CREATE CUSTOM FILTER for custom selections. You can also change the dataset and the connection in this menu.
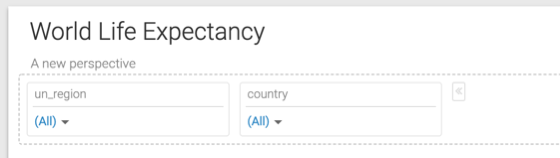
In this example, filters are added ased on the
un_regionandcountrydimensions.
-
Add a title for the dashboard.
Optionally, you can also add a subtitle.
In this example, World Life Expectancy and A new perspective are used as title and subtitle.