Testing calculated fields
In CDP Data Visualization, you can easily test whether a newly calculated field works correctly or not.
-
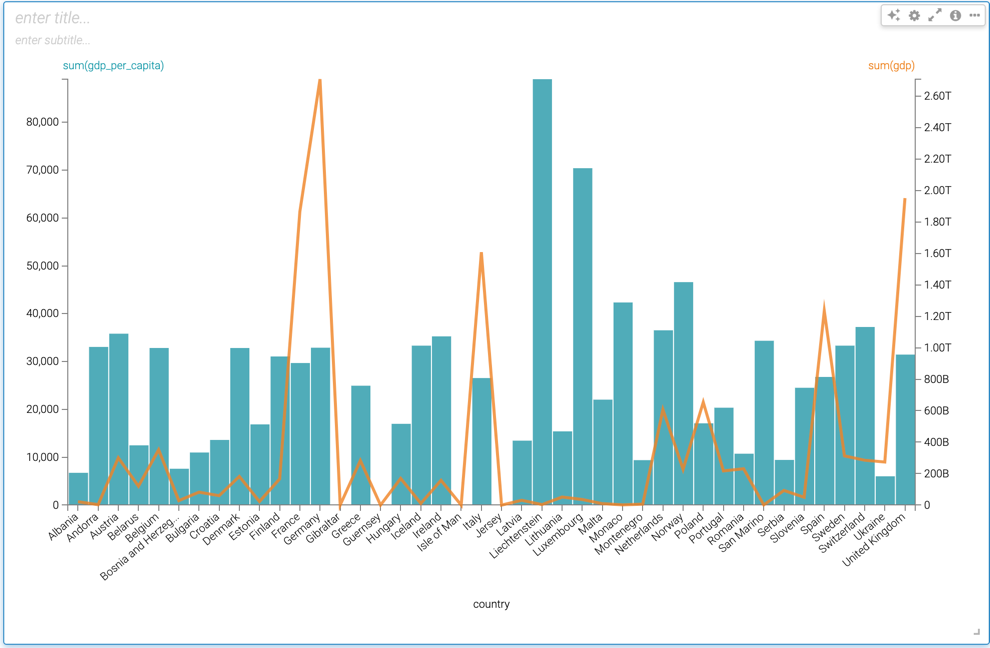
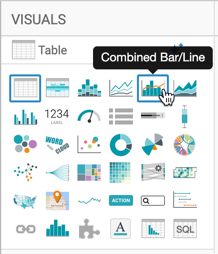
Select the Combined Bar/Line visual type.
-
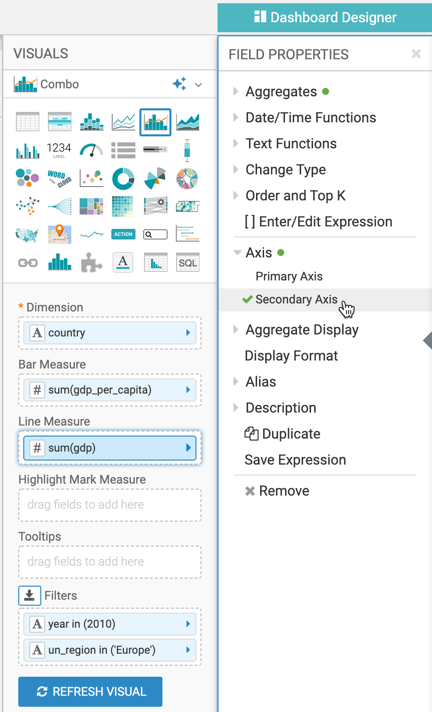
Populate the shelves from the available fields in the following way:
-
In the Field Properties under Axis,
select Secondary Axis.
-
In the Field Properties under Axis,
select Secondary Axis.
The two measurements appear on the graph, superimposed on each other: the original
gdp_per_capita represented by the bars, and the calculated
gdp, represented by the line.