You can change the text color of the filter in
dashboards in CDP Data Visualization. To change the color of the text in all filters of the
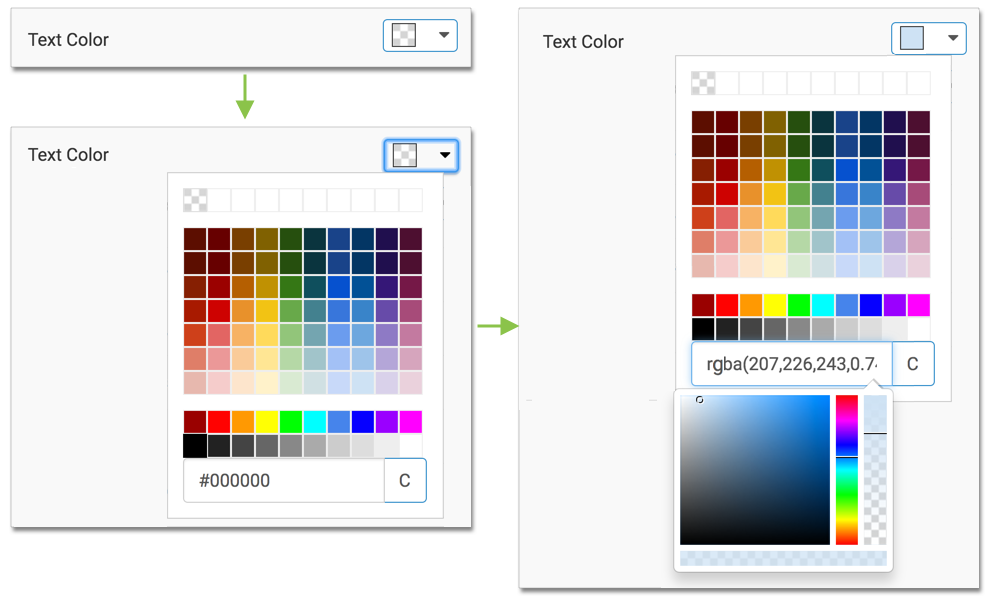
dashboard, navigate to the dashboard Style menu, select the
Filters menu, and select a new color in the Text
Color selector. You can choose from one of the standard system colors, specify a
hexadecimal or RGB color, or select one in the continuous color palette (you can also adjust
color opacity).