Click Behavior Between VisualsPDF version

Creating the control visual

  1. Open (or create) a visual based on US State Population Over Time dataset.

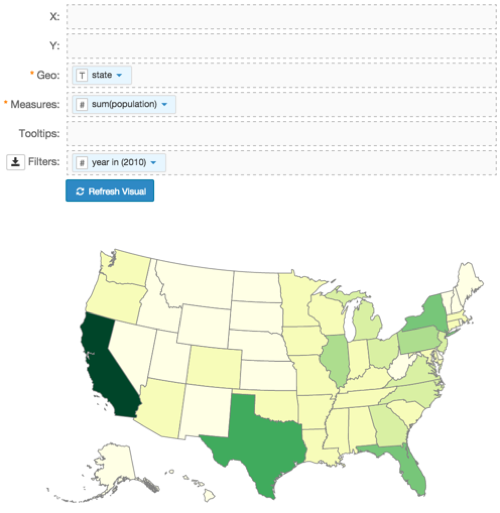
    The specifics for a sample visual follow:

    • Dataset: US State Population Over Time
    • Visual type: map
    • Geo shelf: state field
    • Measures shelf: population field, as sum(population)
    • Filters shelf: year field, as year in (2010)
  2. Click Refresh Visual.
  3. Name this Control Visual, and save it.

We want your opinion

How can we improve this page?

What kind of feedback do you have?