
Cloudera Data Visualization, Visuals interface
The VISUALS interface provides you with visualization features. You can initiate a number of operations when working with visuals.
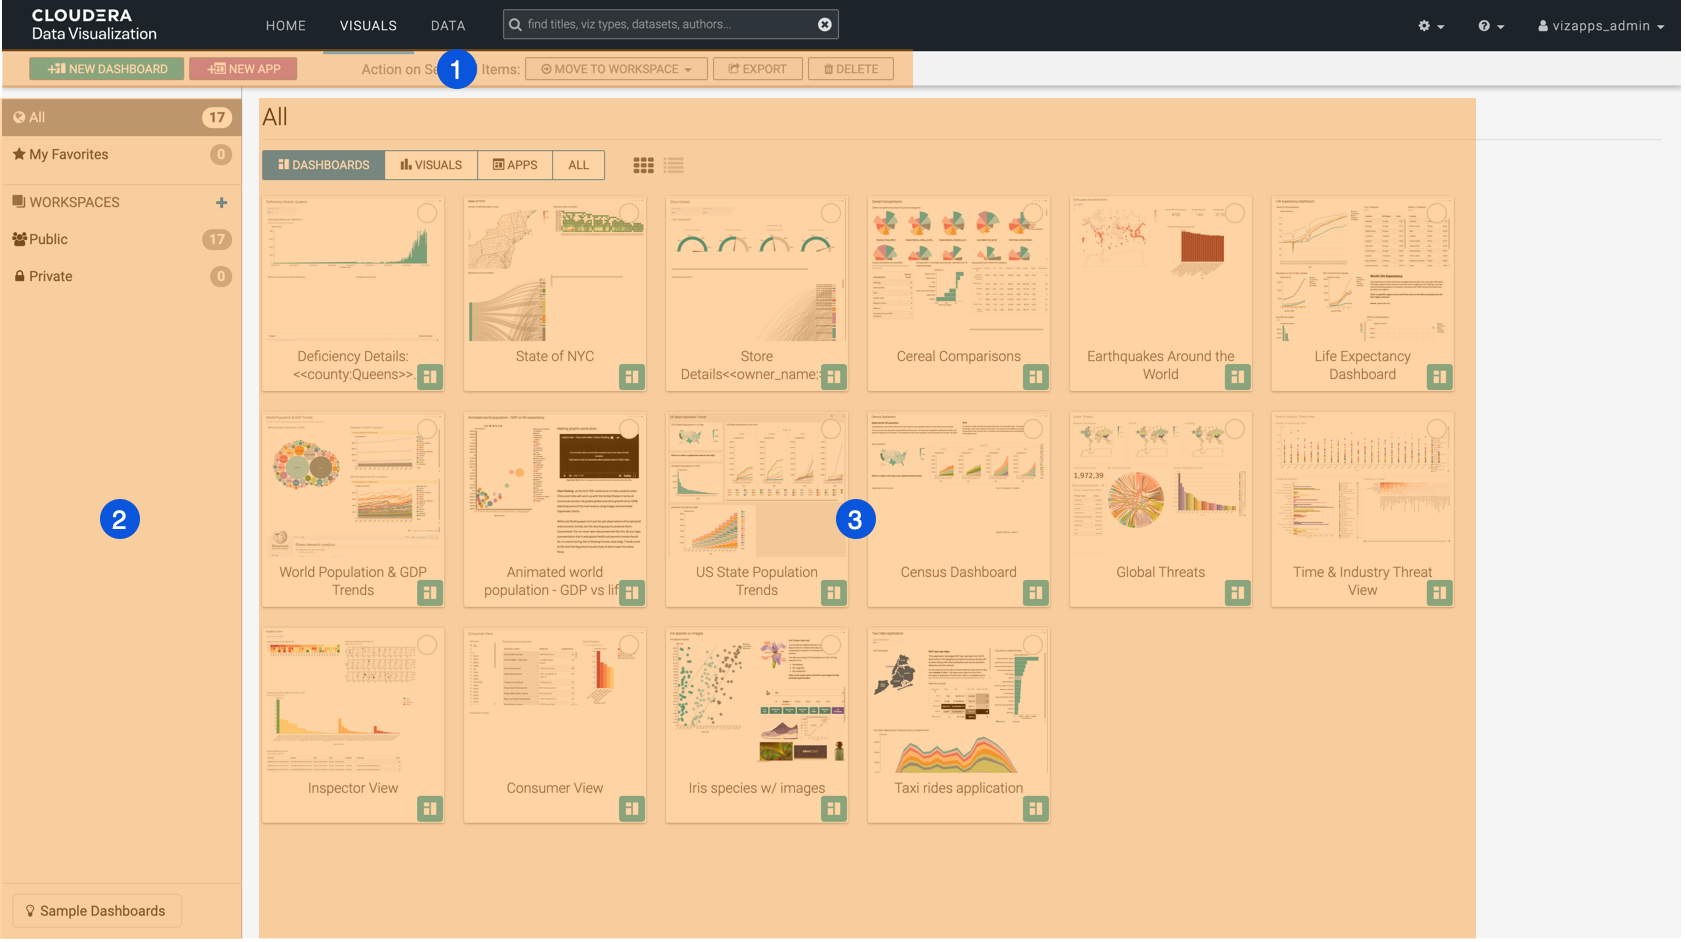
- Visuals top menu bar
- Visuals side menu bar
- Visuals preview area
Visuals top menu bar

-
The NEW DASHBOARD button allows you to start a new dashboard.
-
The NEW APP button allows you to start a new application.
-
The MOVE TO WORKSPACE button helps you to move selected items to a new workspace.
-
The EXPORT button helps you to export visual artifacts to your default download folder.
-
The DELETE button deletes the selected items.
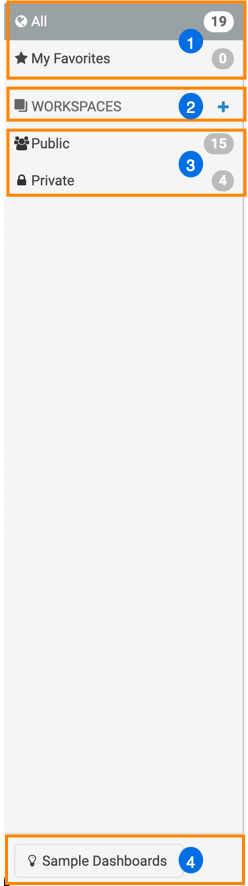
Visuals side menu bar
-
You can access standard groupings of visual artifacts by clicking All or My Favorites.
-
You can create a workspace by clicking the plus sign next to WORKSPACES.
-
Under WORKSPACES, you can see the default workspaces that are available: Private and Public. If you create a custom workspace, it is added to this side menu bar under Private. The number next to each workspace shows you how many dashboards are available in the workspace.
-
The Sample Dashboards button gives you access to examples available in CDP Data Visualization.
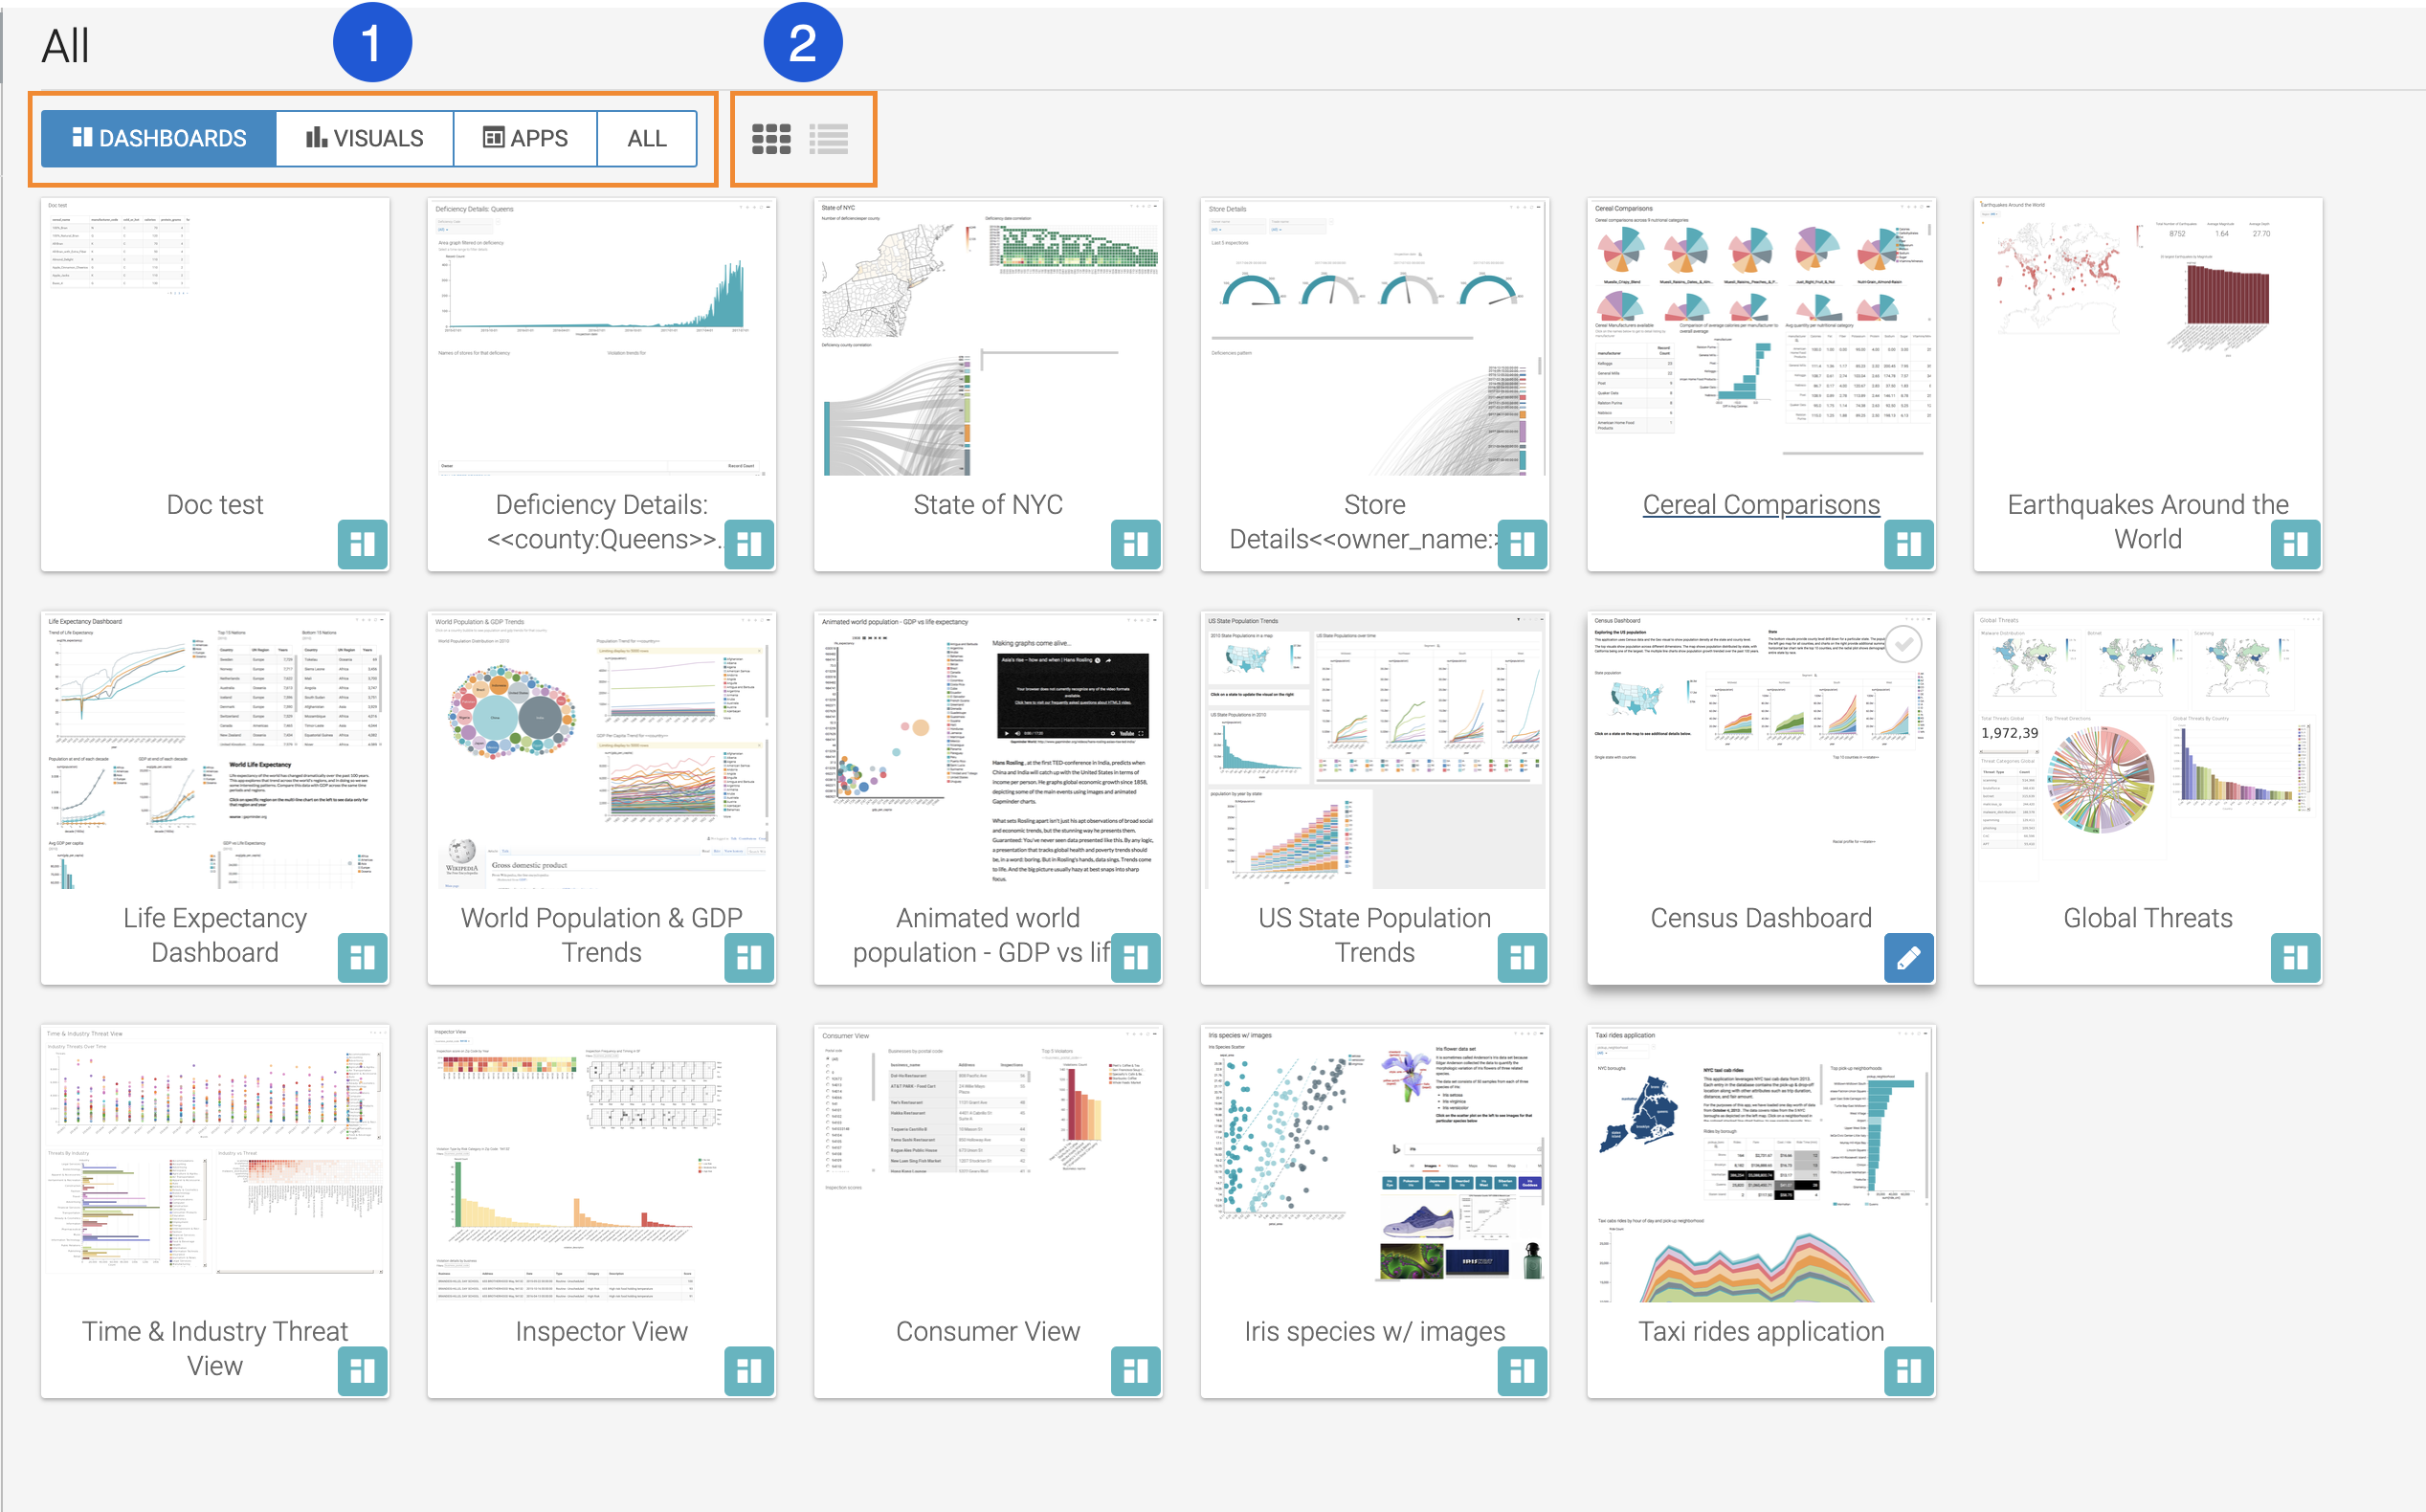
Visuals preview area
-
These buttons allow you to switch between displaying dashboards, visuals, apps, or all visual artifacts in the preview area.
-
These two icons allow you to switch between Grid View and List View. Grid View shows you thumbnail previews of your visuals, dashboards, and applications, while List View presents the same items vertically arranged as a single, continuous, multiple-line list.
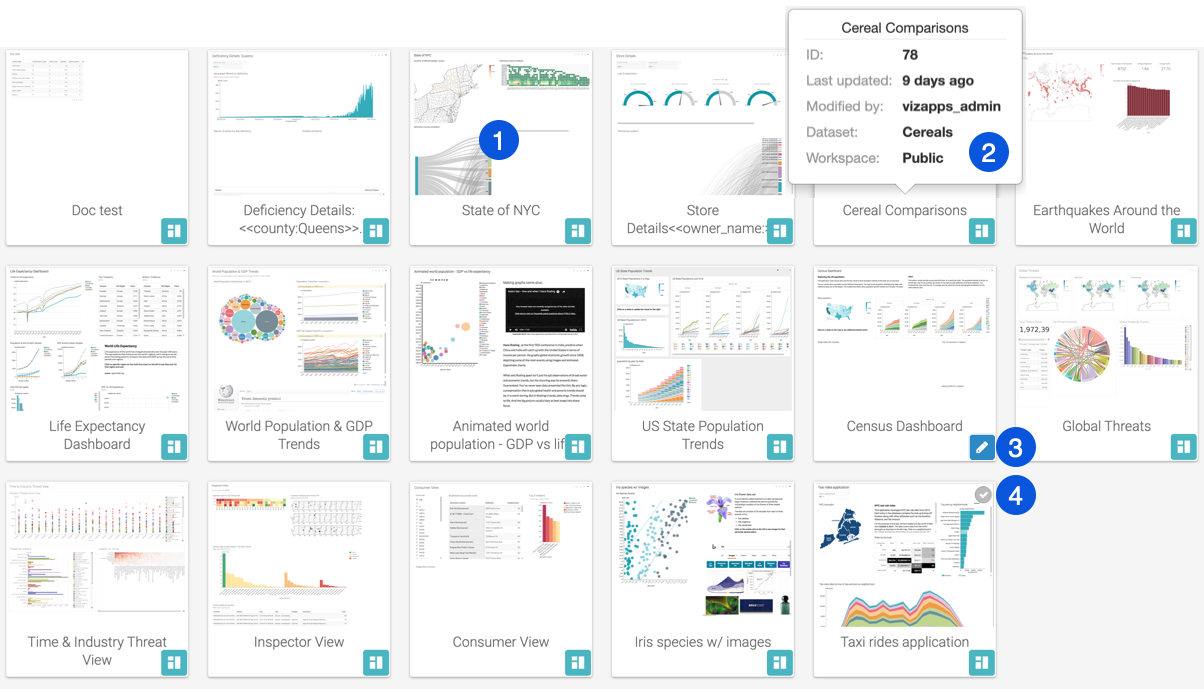
Visuals interface; Grid view
-
You can open a visual artifact by clicking the tile.
-
You can preview information about a visual artifact by hovering over the title until a tooltip appears.
- You can open a dashboard, visual, or app in Edit mode if you hover over the bottom right corner to change the original icon to a (blue pencil/edit) icon.
-
You can select visuals, dashboards, or apps if you hover over the top right corner of a tile and click the checkmark. You can deselect selected visuals and dashboards by clicking the checkmark again.
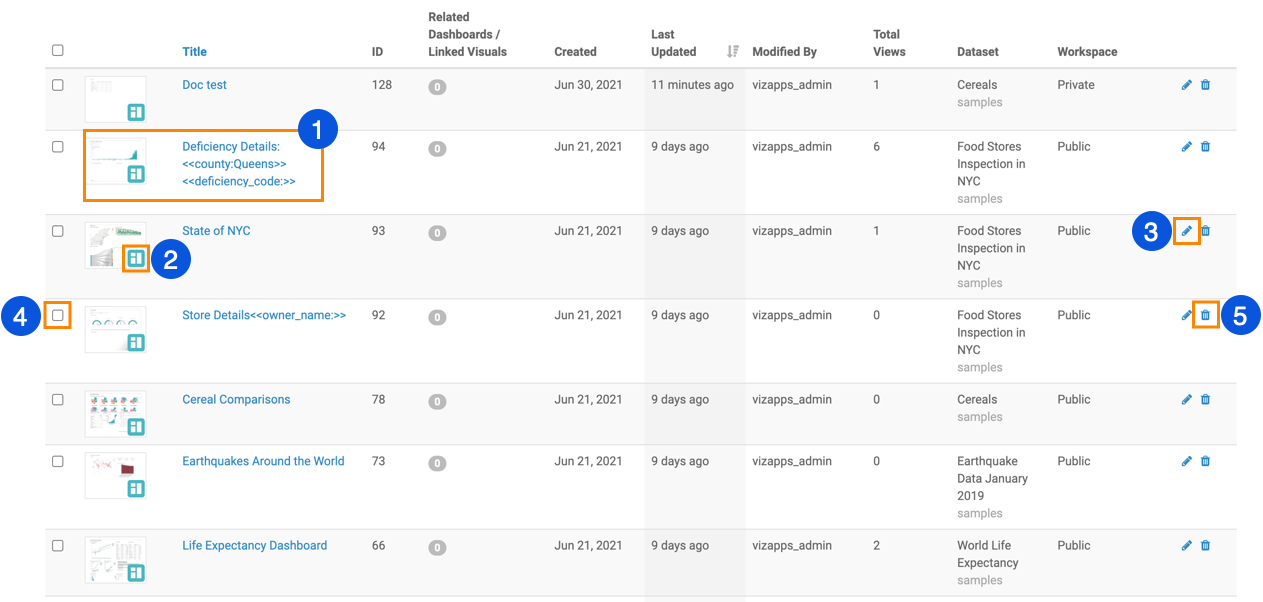
Visuals interface; List view
-
You can open a dashboard, a visual, or an app in View mode if you click the reduced size image or the title of the visual artifact.
-
You can open a dashboard, a visual, or an app in Edit mode if you hover over the bottom right corner of the reduced size image to change the original icon to a (pencil/edit) icon and click it.
-
You can also click the (pencil/edit) at the end of the row if you want to edit a visual artifact.
-
You can select visuals, dashboards, and apps if you mark the check box that corresponds to the item.
-
You can delete a single visual artifact by clicking the (trash/delete) icon at the end of the row that corresponds to it.
