Discovering detailed data behind a visual
You can click on a part of a visual and see the matching rows of data, in detail.
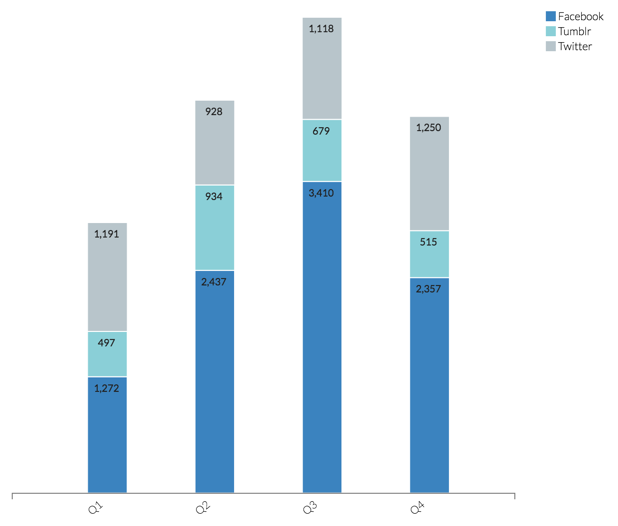
The following steps describe how to access detailed data on a sample visual through. This visual shows the number of social media touch points, on a quarterly basis. While Twitter and Tumblr elements seem relatively constant, Facebook numbers for Q1 are low relative to other quarters. in the example, you can examine the underlying data.
To use this option, you must first enable it, as described in Showing Detail Data Button in Context Menu.
-
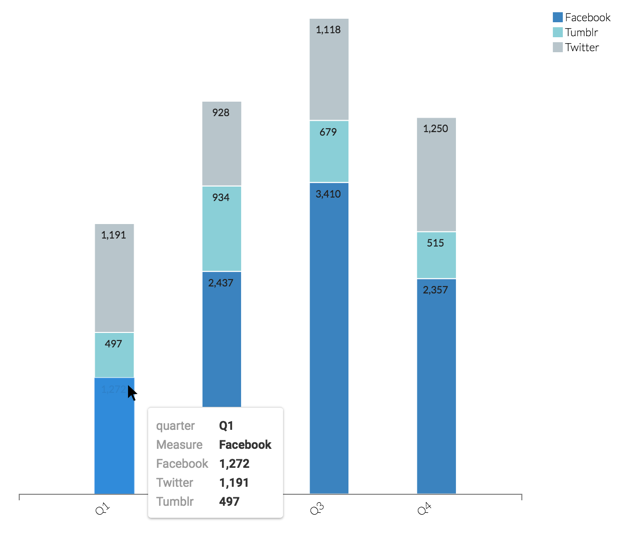
Hover over the Facebook portion of the Q1 bar, and examine the totals that appear on
the tooltip.
-
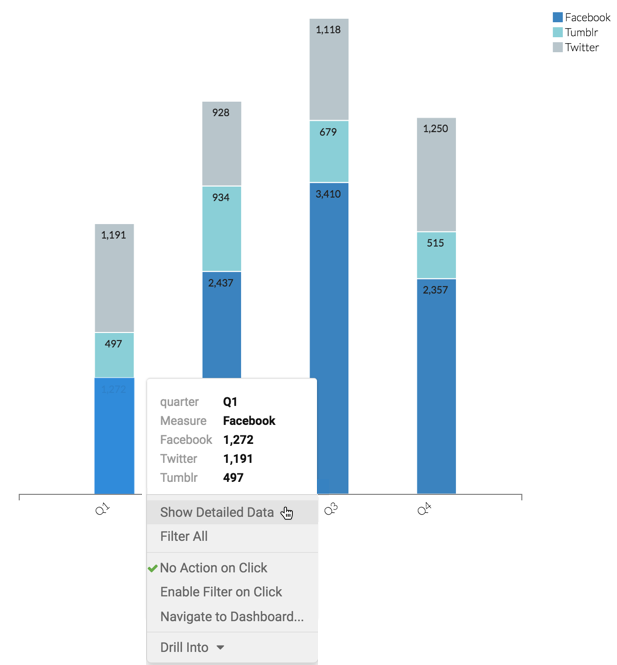
Click the element to see the context menu, and select Show Detailed
Data option.
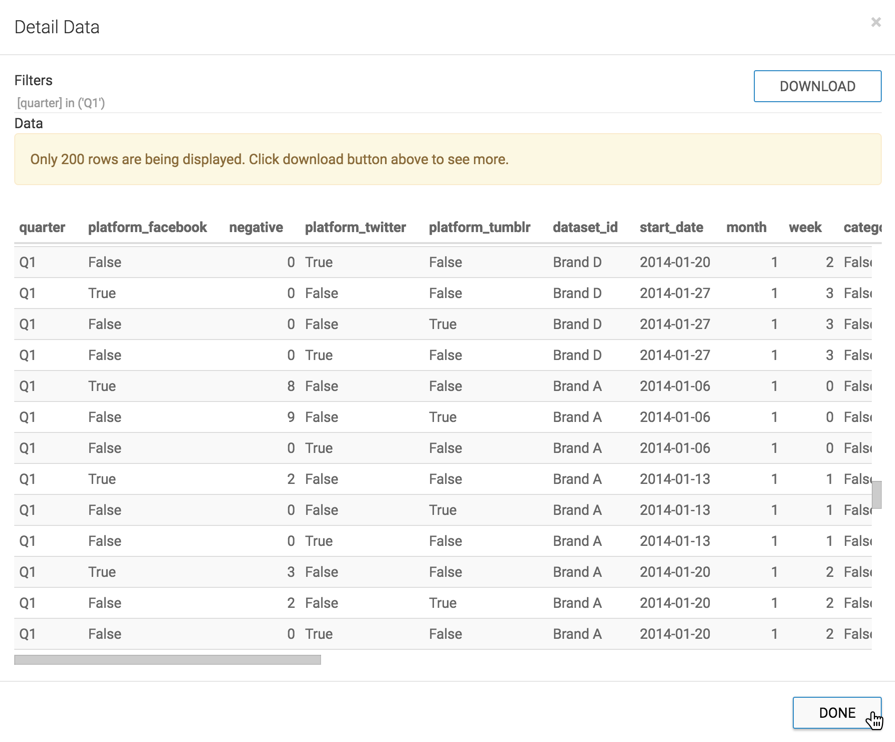
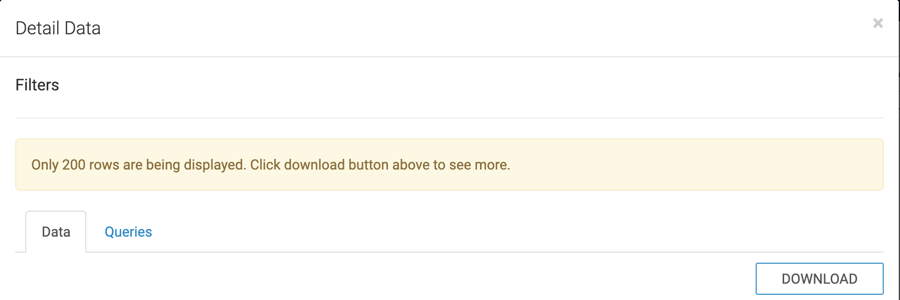
The Detail Data modal window appears. It has two tabs:
- The Data tab shows the raw data that makes up the clicked visual element, as well as all applicable filters.
- The Queries tab shows the SQL queries used to create the visual.
-
Click Download to save the data as a
*.csvfile locally.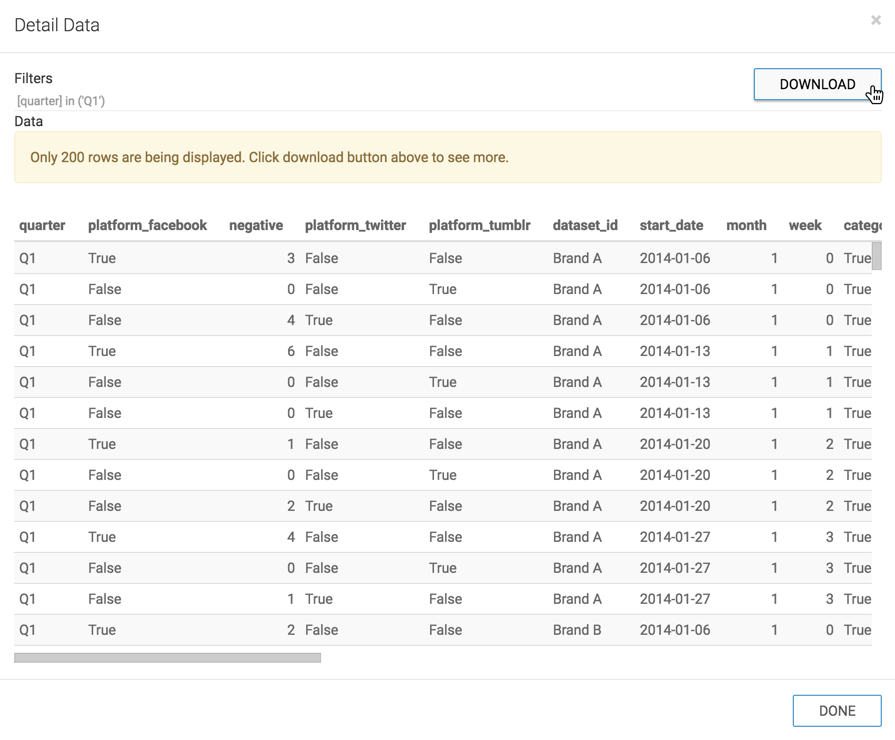
-
After examining the data, click Done to close the modal
window.