Setting minimum cell size
In Correlation Heatmap visuals, CDP Data Visualization enables you to change the minimum size of the component cells of the visual. This setting is only available on Correlation Heatmap visuals.
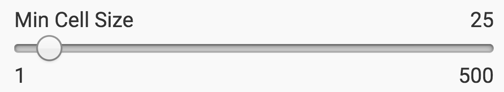
To change the size of a cell in a visual, navigate to the Marks menu, and change the value of the Min Cell Size option. The default is 13 px, and the range is from 1 px to 500 px.
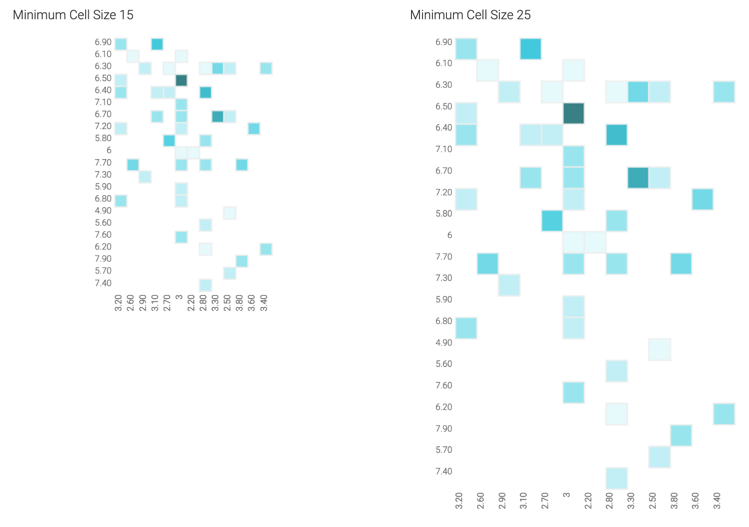
In the following example, compare the appearance of the same visual when the minimum cell size is 15, and when it is 25.