Viewing Service Status
- In the Home page Status tab, if the cluster is displayed in full form, click ServiceName in a ClusterName table.
- In the Home page Status tab, click ClusterName and then click ServiceName.
- Select .
For all service types there is a Status Summary that shows, for each configured role, the overall status and health of the role instance(s).
Each service that supports monitoring provides a set of monitoring properties where you can enable or disable health tests and events, and set thresholds for tests and modify thresholds for the status of certain health tests. For more information see Configuring Monitoring Settings.
The HDFS, MapReduce, HBase, ZooKeeper, and Flume services also provide additional information: a snapshot of service-specific metrics, health test results, health history, and a set of charts that provide a historical view of metrics of interest.
Viewing Past Status
The status and health information shown on this page represents the state of the service or role instance at a given point in time. The exceptions are the charts and the Logs and Events
tabs, which show information for the time range currently selected on the Time Range Selector (which defaults to the past 30 minutes). By default, the information shown on this page is for the
current time. You can view status for a past point in time simply by moving the time marker ( ) to a point in the past.
When you move the time marker to a point in the past (for Services/Roles that support health history), the Health Status clearly indicates that it is referring to a past time. A Now
button ( ) allows you to quickly switch to view the current state of the service. In addition, the Actions menu is disabled while you are viewing
status in the past – to ensure that you cannot accidentally take an action based on outdated status information.
) allows you to quickly switch to view the current state of the service. In addition, the Actions menu is disabled while you are viewing
status in the past – to ensure that you cannot accidentally take an action based on outdated status information.
See Time Line for more details.
Status Summary
The Status Summary shows the status of each service instance being managed by Cloudera Manager. Even services such as Hue, Oozie, or YARN (which are not monitored by Cloudera Manager) show a status summary. The overall status for a service is a roll-up of the health test results for the service and all its role instances. The Status can be:
| Indicator | Status | Description |
|---|---|---|
 |
Started with outdated configuration | For a service, this indicates the service is running, but at least one of its roles is running with a configuration that does not match the current configuration settings in Cloudera Manager. For a role, this indicates a configuration change has been made that requires a restart, and that restart has not yet occurred. Click the indicator to display the Stale Configurations page. |
 |
Starting | The entity is starting up but is not yet running. |
 |
Stopping | The entity is stopping but has not stopped yet. |
 |
Stopped | The entity is stopped, as expected. |
 |
Down | The entity is not running, but it is expected to be running. |
 |
History not available | Cloudera Manager is in historical mode, and the entity does not have historical monitoring support. This is the case for services other than HDFS, MapReduce and HBase such as ZooKeeper, Oozie, and Hue. |
 |
None | The entity does not have a status. For example, it is not something that can be running and it cannot have health. Examples are the HDFS Balancer (which runs from the HDFS Rebalance action) or Gateway roles. The Start and Stop commands are not applicable to these instances. |
 |
Good health | The entity is running with good health. For a specific health test, the returned result is normal or within the acceptable range. For a role or service, this means all health tests for that role or service are Good. |
 |
Concerning health | The entity is running with concerning health. For a specific health test, the returned result indicates a potential problem. Typically this means the test result has gone above (or below) a configured Warning threshold. For a role or service, this means that at least one health test is Concerning. |
 |
Bad health | The entity is running with bad health. For a specific health test, the test failed, or the returned result indicates a serious problem. Typically this means the test result has gone above (or below) a configured Critical threshold. For a role or service, this means that at least one health test is Bad. |
 |
Disabled health | The entity is running, but all of its health tests are disabled. |
 |
Unknown health | The status of a service or role instance is unknown. This can occur for a number of reasons, such as the Service Monitor is not running, or connectivity to the Agent doing the health monitoring has been lost. |
You can click either the Status link for a role to drill down to see the details of the status of the role instance(s). If there is a single instance of the role type, the link takes you directly to the role instance status.
If there are multiple role instances (such as for DataNodes, TaskTrackers, RegionServers) clicking  to the right of the role's health

displays a pop-up that allows you to select specific instances. Furthermore, this pop-up displays the results for each health test that applies to this role type.
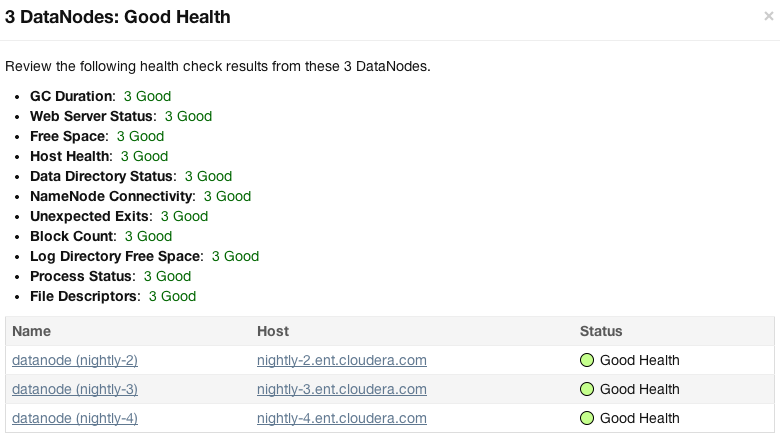
You can filter by an individual health test result. Click the result link - an  appears by the link
(as shown in the illustration above) and only the instance(s) with that specific health status will appear in the instances list.
appears by the link
(as shown in the illustration above) and only the instance(s) with that specific health status will appear in the instances list.
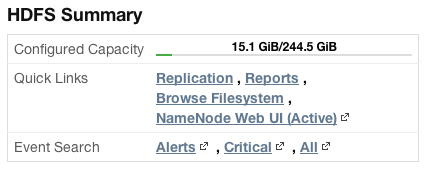
Service Summary
- The HDFS Summary shows disk space usage.
- The MapReduce Summary shows statistics on slot usage, jobs and so on.
- The Flume Summary provides a link to a page of Flume metric details. See Flume Metric Details.
- The ZooKeeper Summary provides links to the ZooKeeper role instances (nodes) as well as Zxid information if you have a ZooKeeper Quorum (multiple ZooKeeper servers).
For example:
Other services such as Hue, Oozie, Impala, and Cloudera Manager itself, do not provide a Service Summary.
Health Tests and Health History
The Health Tests and Health History panels appear for HDFS, MapReduce, HBase, Flume, Impala, ZooKeeper, and the Cloudera Manager Service. Other services such as Hue, Oozie, and YARN do not provide a Health Test panel.
The Health Tests panel shows health test results in an expandable and collapsible list, typically with the specific metrics that the test returned. (You can Expand All or Collapse All from the links at the upper right of the Health Tests panel).
- The color of the text (and the background color of the field) for a Health Test result indicates the status of the results. The tests are sorted by their health status – Good, Concerning, Bad, or Disabled. The entries are collapsed by default. Click the arrow to the left of an entry to expand the entry and display further information.
- Clicking the Details link for a health test displays further information about the test, such as the meaning of the test and its possible results, suggestions for actions you can take or how to make configuration changes related to the test. The help text may include a link to the relevant monitoring configuration section for the service. See Configuring Monitoring Settings for more information.
- In the Health Tests panel:
- Clicking
 displays the lists of health tests that contributed to the health test.
 - Clicking the Details link displays further information about the health test.
- Clicking
- In the Health History panel:
- Clicking displays the lists of health tests that contributed to the health history.
- Clicking the Show link moves the time range to the historical time period.
- Clicking
Charts
HDFS, MapReduce, HBase, ZooKeeper, Flume, and Cloudera Management Service all display charts of some of the critical metrics related to their performance and health. Other services such as Hive, Hue, Oozie, and Solr do not provide charts.
See Viewing Charts for Cluster, Service, Role, and Host Instances for detailed information on the charts that are presented, and the ability to search and display metrics of your choice.
Flume Metric Details
From the Flume Service Status page, click the Flume Metric Details link in the Flume Summary panel to display details of the Flume agent roles.
On this page you can view a variety of metrics about the Channels, Sources and Sinks you have configured for your various Flume agents. You can view both current and historical metrics on this page.
The Channels section shows the metrics for all the channel components in the Flume service. These include metrics related to the channel capacity and throughput.
The Sinks section shows metrics for all the sink components in the Flume service. These include event drain statistics as well as connection failure metrics.
The Sources section shows metrics for all the source components in the Flume service.
This page maintains the same navigation bar as the Flume service status page, so you can go directly to any of the other tabs (Instances, Commands, Configuration, or Audits).
