YARN Applications
The YARN Applications page displays information about the YARN jobs that are running and have run in your cluster. You can filter the jobs by time period and by specifying simple filtering expressions.
Viewing Jobs
- Do one of the following:
- Select .
- On the tab, select YARN service name and click the Applications tab.
Configuring YARN Application Monitoring
You can configure the visibility of the YARN application monitoring results.
For information on how to configure whether admin and non-admin users can view all applications, only that user's applications, or no applications, see Configuring Application Visibility.
Jobs List
Jobs are ordered with the most recent at the top. Each job has summary and detail information. A job summary includes the following attributes: start and end timestamps, query (if the
job is part of a Hive query) name, queue, job type, job ID, and user. For example:

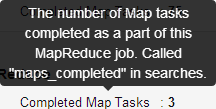
You can add additional attributes to the summary with the Attribute Selector. To display information about job attributes and possible values, hover over a field in an entry. For example:
A running job displays  under the start timestamp.
To kill a running job, select . Only an administrator can kill
jobs and killing a job creates an audit event. When you kill a job  replaces the label. Once the page is refreshed, the entry is removed from the list.
To view a completed job in the JobHistory server, select .
To display all the jobs run by the same user, select .
Filtering Jobs
You filter jobs by selecting a time range and specifying a filter expression in the Search box.
You can use the Time Range Selector or a duration link (  ) to set the time range.
(See Time Line for details).
) to set the time range.
(See Time Line for details).
Filter Expressions
- Attribute - the query language name of the attribute.
- Operator - the type of comparison between the attribute and the attribute value. Cloudera Manager supports the standard comparator operators: =, !=, >, <, >=, <=, and RLIKE, which does regular expression matching as specified in the Java Pattern class documentation. Numeric values can be compared with all operators. String values can be compared with =, !=, and RLIKE. Boolean values can be compare with = and !=.
- Value - the value of the attribute. The value depends on the type of the attribute. For a Boolean value, specify either true or false. When specifying a string value, enclose the value in double quotes.
You create compound filter expressions using the AND and OR operators. When more than one operator is used in an expression, AND is evaluated first, then OR. To change the order of evaluation, surround subexpressions with parentheses.
Compound Expressions
user = "root" AND application_duration >= 100000.0
maps_completed >= 200.0 AND (user = "Jack" OR user = "Jill")
Choosing and Running a Filter
- Do one of the following:
- Select a Suggested or Recently Run Filter
- Click the
 to the right of the Search button to display
a list of sample and recently run filters, and select a filter. The filter text displays in the text box.
to the right of the Search button to display
a list of sample and recently run filters, and select a filter. The filter text displays in the text box.
- Click the
- Construct a Filter from Attribute Histograms
- Optionally, click the Select Attributes link to display a dialog where you can chose which attributes to display in histograms. Check the checkbox next to one or more attributes, and click Close.
- Click the Enhance Filter link. Histograms of the selected attributes display with the number of results that match each value of the selected attributes.
- Click a histogram bar that represents the range of attribute values to filter on. The color of the histogram bar gets lighter (on the right below)
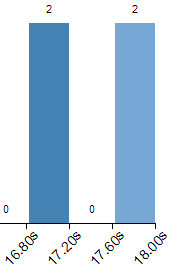
and a filter with the attribute value set to the range of the histogram bucket is added to the text box. The range includes the lower bound of the bucket and excludes the upper bound of the bucket. For example:(<x>_duration >= 17600.0 AND <x>_duration < 18000.0)
where <x> is query or application.If you click the same histogram bar again, the color reverts to the darker blue and the filter is removed from the text box.
If you click another histogram bar, another filter is OR'd with the existing filter:(<x>_duration >= 17600.0 AND <x>_duration < 18000.0 OR <x>_duration >= 16000.0 AND <x>_duration < 16400.0)
- Type a Filter
- Start typing or press Spacebar in the text box. As you type, filter attributes matching the letter you type display. If you press Spacebar, standard filter attributes display. These suggestions are part of typeahead, which helps build valid queries. For information about the attribute name and supported values for each field, hover over the field in an existing query.
- Select an attribute and press Enter.
- Press Spacebar to display a drop-down list of operators.
- Select an operator and press Enter.
- Specify an attribute value in one of the following ways:
- For attribute values that support typeahead, press Spacebar to display a drop-down list of values and press Enter.
- Type a value.
- Select a Suggested or Recently Run Filter
- Put the cursor on the text box and press Enter or click Search. The list displays the results that match the specified filter. If the histograms are showing, they are redrawn to show only the values for the selected filter. The filter is added to the Recently Run list.
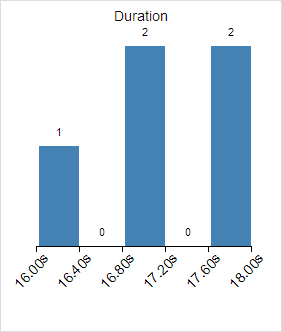
Example: Drilling into Query Results
Suppose we have a set of results with the following duration distribution :
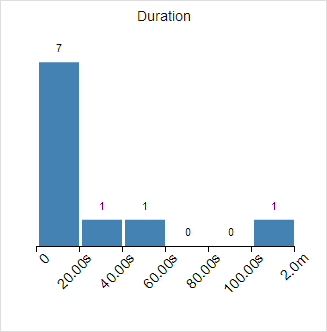
The 0-20.00s bucket has 7 results, but with the current distribution we cannot discriminate between the results in that bucket.
<x>_duration >= 0.0 AND <x>_duration < 20000.0
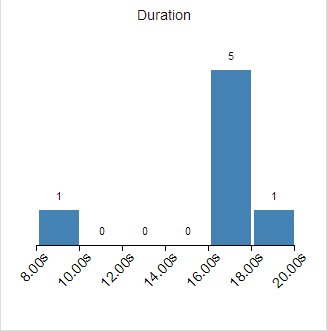
<x>_duration >= 16000.0 AND <x>_duration < 18000.0After clicking Search again, the histogram appears as follows:
Filter Attributes
Commonly-used filter attributes, their names as they are displayed in Cloudera Manager, their types, and descriptions, are enumerated below.
|
Attribute |
Display Name |
Value Type |
Description |
|---|---|---|---|
| application_duration | Duration | integer (milliseconds) | How long YARN took to execute this application. |
| application_id | Application ID | string | The ID of the YARN application. |
| cpu_time | Total CPU Time | integer (milliseconds) | The total amount of CPU time used by the tasks for this YARN application. |
| disk_input_bytes | Disk Input Bytes | integer (bytes) | The number of bytes read from local files by this YARN application. |
| disk_output_bytes | Disk Output Bytes | integer (bytes) | The number of bytes written to local files by this YARN application. |
| mapper_class | Map Class | string | The class used by the map tasks in this YARN application. |
| name | Name | string | Name of the YARN application. |
| pool | Pool | string | The name of the pool that this application was submitted to. Within YARN a pool is referred to as a queue. |
| reducer_class | Reduce Class | string | The class used by the reduce tasks in this YARN application. |
| service_name | Service Name | string | The name of the YARN service. |
| shuffle_bytes | Shuffle Bytes | integer (bytes) | The number of bytes fetched from mappers over HTTP during the reduce phase. |
| state | Application State | string | The state of this YARN application. This reflects the ResourceManager state while the application is executing and the Job History Server state after the application has completed. |
| user | User | string | The user who ran the YARN application. |
Examples
Consider the following filter expressions: user = "root", rowsProduced > 0, fileFormats RLIKE ".TEXT.*", and executing = true. In the examples:
- The filter attributes are user, rowsProduced, fileFormats, and executing.
- The operators are =, >, and RLIKE.
- The filter values are root, 0, .TEXT.*, and true.
