Cloudera Navigator Lineage Diagrams
Cloudera Navigator provides an automatic collection and easy visualization of upstream and downstream data lineage to verify reliability. For each data source, it shows, down to the column-level within that data source, what the precise upstream data sources were, the transforms performed to produce it, and the impact that data has on downstream artifacts.
A lineage diagram is a directed graph that depicts an extracted entity and its relations with other entities. A lineage diagram is limited to 3000 entities.
- Template - represents a diagram that is a model for other diagram
- Instance - represents an instance or execution of a template
Entities
| HDFS | Pig | ||
|
|
|
|
| Hive and Impala | Spark (Unsupported - and disabled by default. To enable, see Enabling Spark Metadata Extraction.) | ||
|
|
|
|
| MapReduce and YARN | Sqoop | ||
|
|
|
|
| Oozie | |||
|
|
||


 :
:
- The entity has not yet been extracted. In this case will eventually be replaced with the
correct entity icon after the entity is extracted and linked in Navigator. For information on how long it takes for newly created entities to be extracted, see Metadata Extraction.
- A Hive entity has been deleted from the system before it could be extracted.
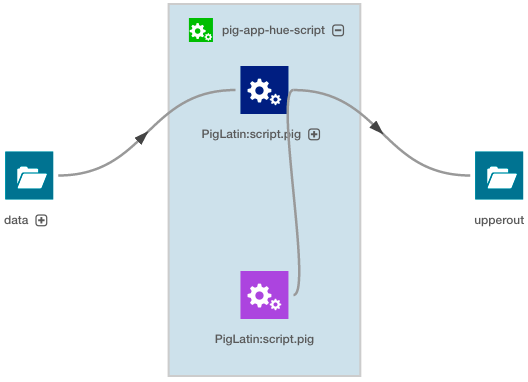
Parent entities are represented by a blue box enclosing other entities. The following lineage diagram illustrates the relations between the YARN job script.pig and Pig script script.pig invoked by the parent Oozie workflow pig-app-hue-script and the source file in
the data folder and destination folder upperout:
Relations
Relations between the entities are represented graphically by gray lines, with arrows indicating the direction of the data flow. There are the following types of relations:
| Relation Type | Description |
|---|---|
| Data flow | Describes a relation between data and a processing activity. For example, between a file and a MapReduce job or vice versa. |
| Alias | Describes an alias relation. For example, from a table to a synonym. |
| Parent-child | Describes a parent-child relation. For example, between a directory and a file. |
| Logical-physical | Describes the relation between a logical entity and its physical entity. For example, between a Hive query and a MapReduce job. |
| Conjoint | Describes a non-directional relation. For example, between a table and an index. |
| Instance of | Describes the relation between a template and its instance. For example, an operation execution is an instance of operation. |
| Control flow | Describes a relation where the source entity controls the data flow of the target entity. For example, between the columns used in an insert clause and the where clause of a Hive query. |
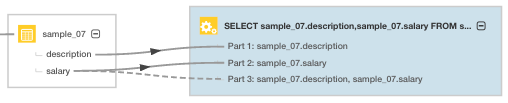
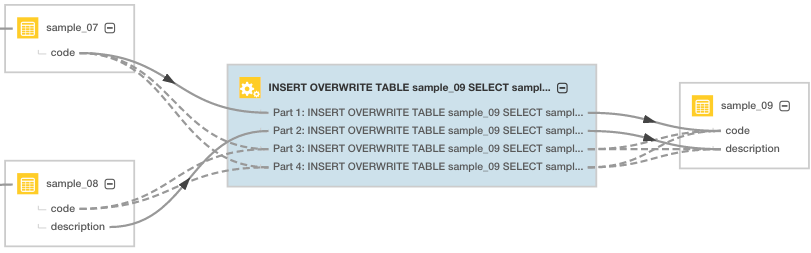
- A solid line (
 ) represents a "data flow" relationship, indicating that the columns will appear
(possibly transformed) in the output. For example, a solid line will appear between the columns used in a select clause.
) represents a "data flow" relationship, indicating that the columns will appear
(possibly transformed) in the output. For example, a solid line will appear between the columns used in a select clause. - A dashed line (
 ) represents a "control flow" relationship, indicating that the columns
determine which rows will flow to the output. For example, a dashed line will appear between the columns used in an insert or select
clause and the where clause of a Hive query.
) represents a "control flow" relationship, indicating that the columns
determine which rows will flow to the output. For example, a dashed line will appear between the columns used in an insert or select
clause and the where clause of a Hive query.
SELECT sample_07.description,sample_07.salary FROM sample_07
WHERE ( sample_07.salary > 100000)
ORDER BY sample_07.salary DESC LIMIT 1000
has solid lines between the columns in the select clause and a dashed line between the columns in the where clause:
Manipulating Lineage Diagrams
You can click a  icon in a parent entity to display its child entities. For example, you can
click the Pig script to display its child tables:
icon in a parent entity to display its child entities. For example, you can
click the Pig script to display its child tables:
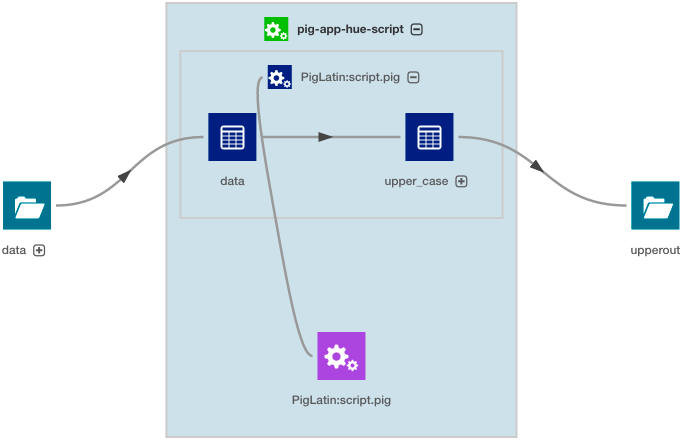
- To improve the layout of a lineage diagram you can drag and drop entities (in this case data and upperout) located outside a parent box.
- You can use the mouse scroll wheel or the
 control to zoom the lineage diagram in and out.
 - You can move an the entire lineage diagram in the lineage pane by pressing the mouse button and dragging it.
Displaying a Template Lineage Diagram
A template lineage diagram contains template entities, such as jobs and queries, that can be instantiated, and the input and output entities to which they are related.
- Perform a metadata search.
- In the list of results, click an Operation or Query result entry.
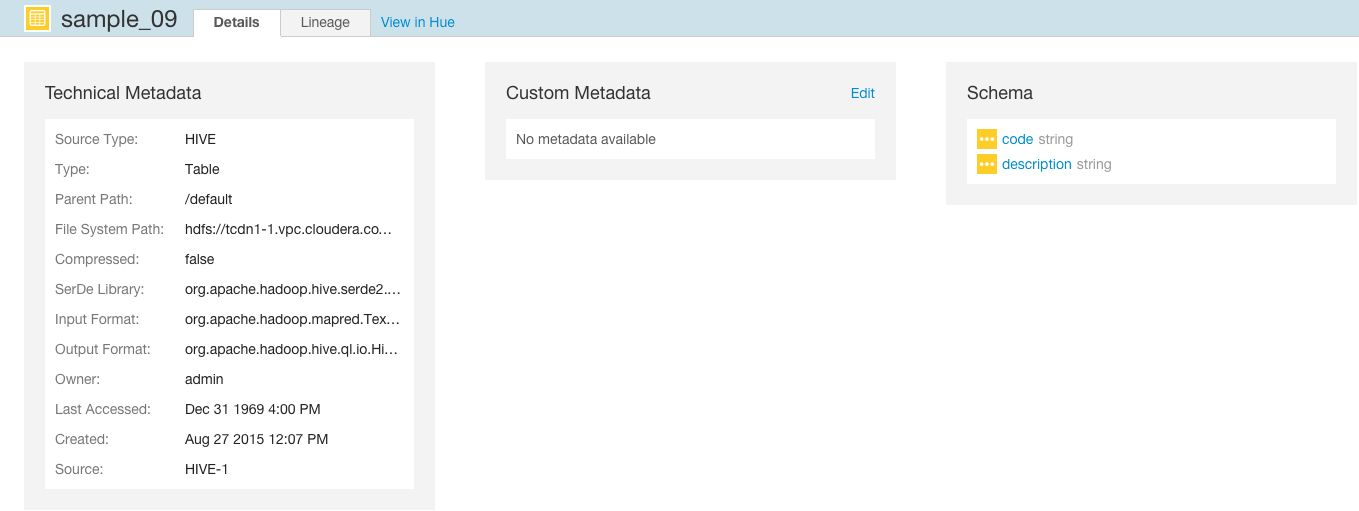
- Click the Lineage tab. For example, when you click the sample_09 result entry:

the Search screen is replaced with a Details page that displays the entity property sheet:
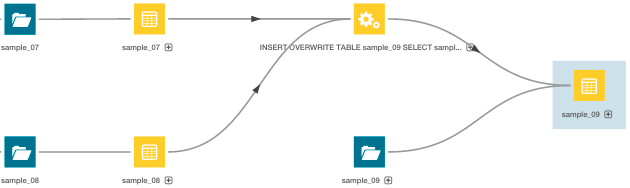
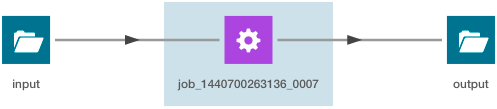
After you click the Lineage tab, the lineage diagram displays:
Displaying an Instance Lineage Diagram
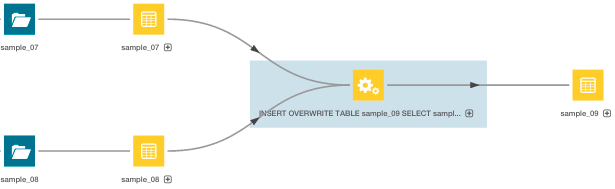
An instance lineage diagram displays instance entities, such as job and query executions, and the input and output entities to which they are related. To display an instance lineage diagram:
- Perform a search and click a link of type Operation.
- Click a link in the Instances box.
- Click the Lineage tab:
Displaying the Template Lineage Diagram for an Instance Lineage Diagram
You can navigate from an instance diagram to its template.
- Display an instance lineage diagram.
- Click the Details tab.
- Click the value of the Template property to go to the instance's template.