Using Hue
This section provides information about how to use Hue for the following tasks:
Try the following tutorial to get started using Hue immediately.
Getting Started with Hue
Analyze and visualize your data with Impala, a high-speed, low-latency SQL query engine.
- Download and unzip one year of bike trips from the Bay Area Bike Share program. This file is about 80 MB in size.
- Create a table from the ~/babs_open_data_year_1/201402_babs_open_data/201402_trip_data.csv file found in the unzipped babs_open_data_year_1.zip file:
- In the Cloudera Manager Admin Console, select to launch Hue.
-
In the left panel of Hue, make sure the default database is selected, and click the plus sign to create a table:
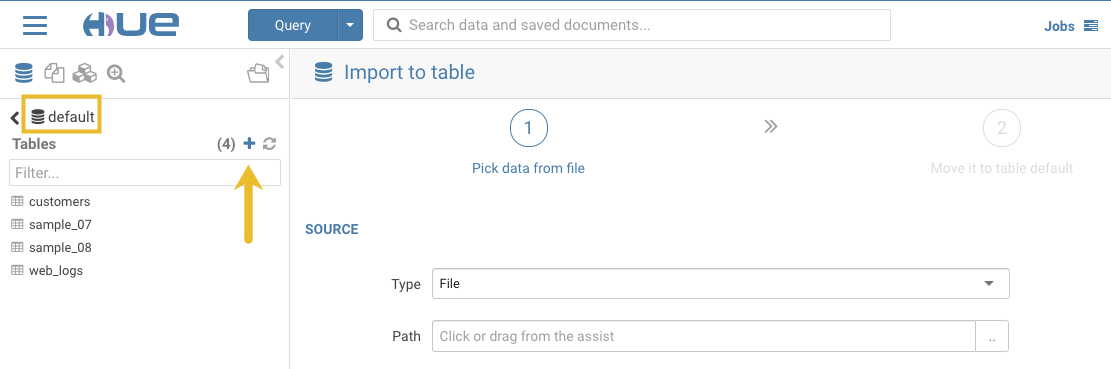
If the default database is not selected, click the "less than" icon
 that is next to the
database icon in the left panel. This enables you to select the default database.
that is next to the
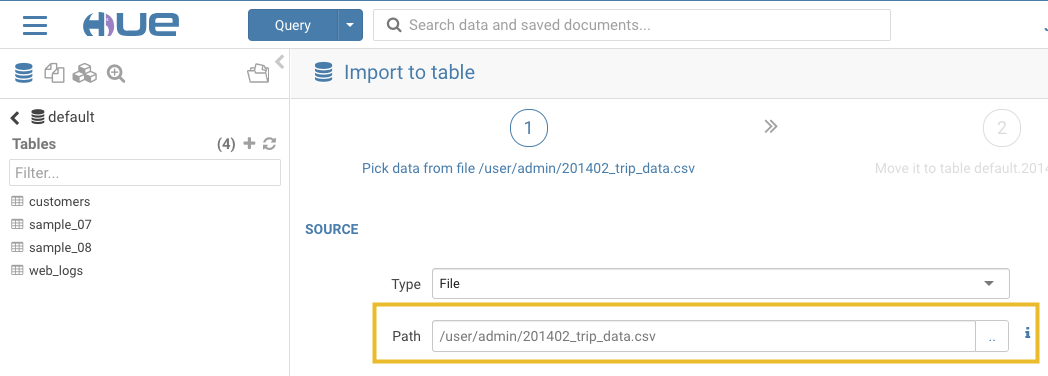
database icon in the left panel. This enables you to select the default database. - In the center panel Importer UI, set Type to File.
-
Drag the 201402_trip_data.csv file to the Path field:
-
Set the formats as follows:
- Field Separator = Comma (,)
- Record Separator = New line
- Quote Character = Double Quote
Then click Next at the bottom of the page.
- Set the properties Format = Text.
-
Edit the FIELDS as follows:
- Rename Bike # to Bike ID
- Change the data type of ZipCode to string.
- Remove all of the spaces in the Name fields.
Then click Submit at the bottom of the page.
-
Click Query at the top of the page and select to open the HiveQL editor and then create a query.
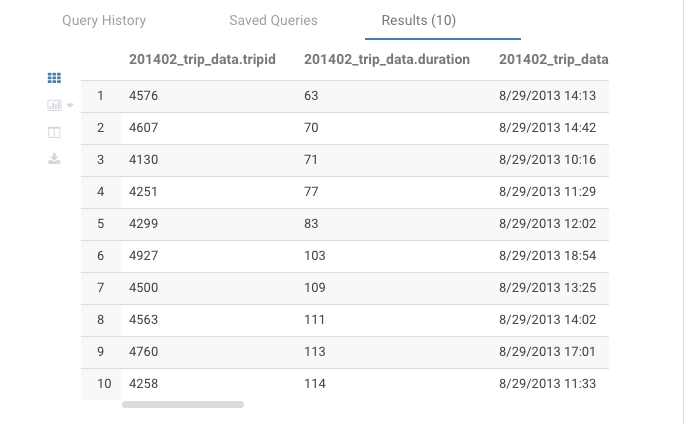
- Enter the following query into the editor window:
SELECT * FROM default.201402_trip_data LIMIT 10; -
Click the execute icon
 to run the query. The following rows are returned:
- Enter the following query into the editor window:
-
Click Query at the top of the page and select to open the Impala SQL editor and then create a query.
-
In the left panel, click the refresh icon and select Perform incremental metadata update to make the new table visible to Impala:
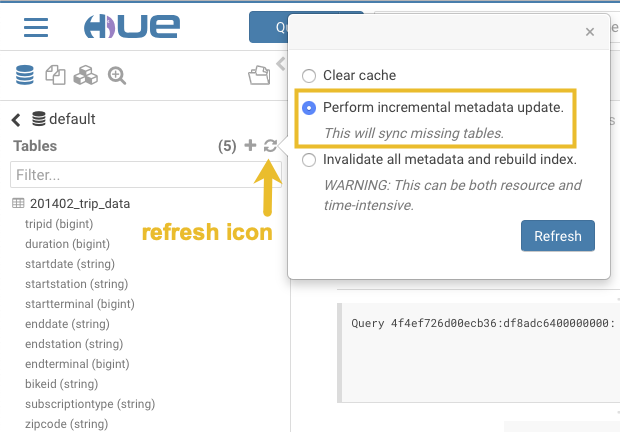
-
Enter the following query into the editor window:
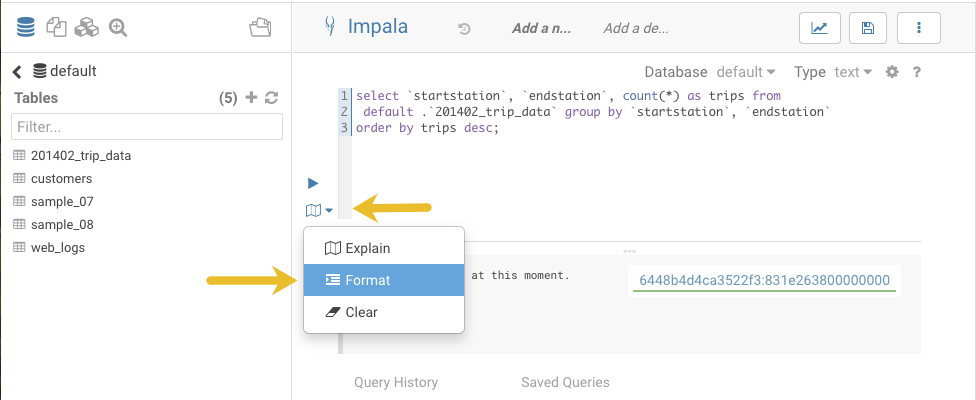
select 'startstation', 'endstation', count(*) as trips from default.'201402_trip_data' group by 'startstation', 'endstation' order by trips desc; -
Click the down arrow just under the execution icon and select Format:
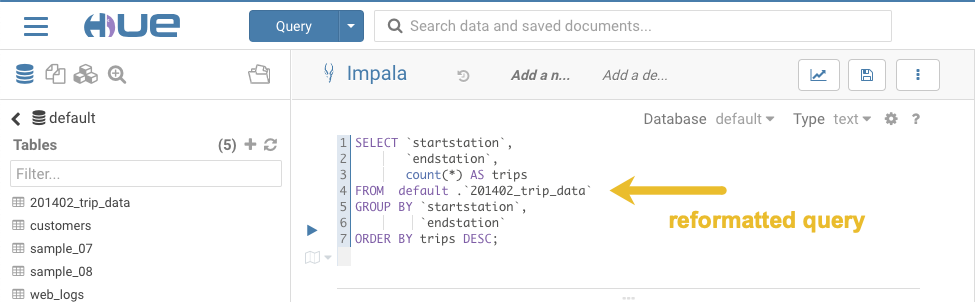
This reformats the query:
- Click the save icon
 , enter a query name, and click Save.
 - Click the execute icon to run the query.
-
-
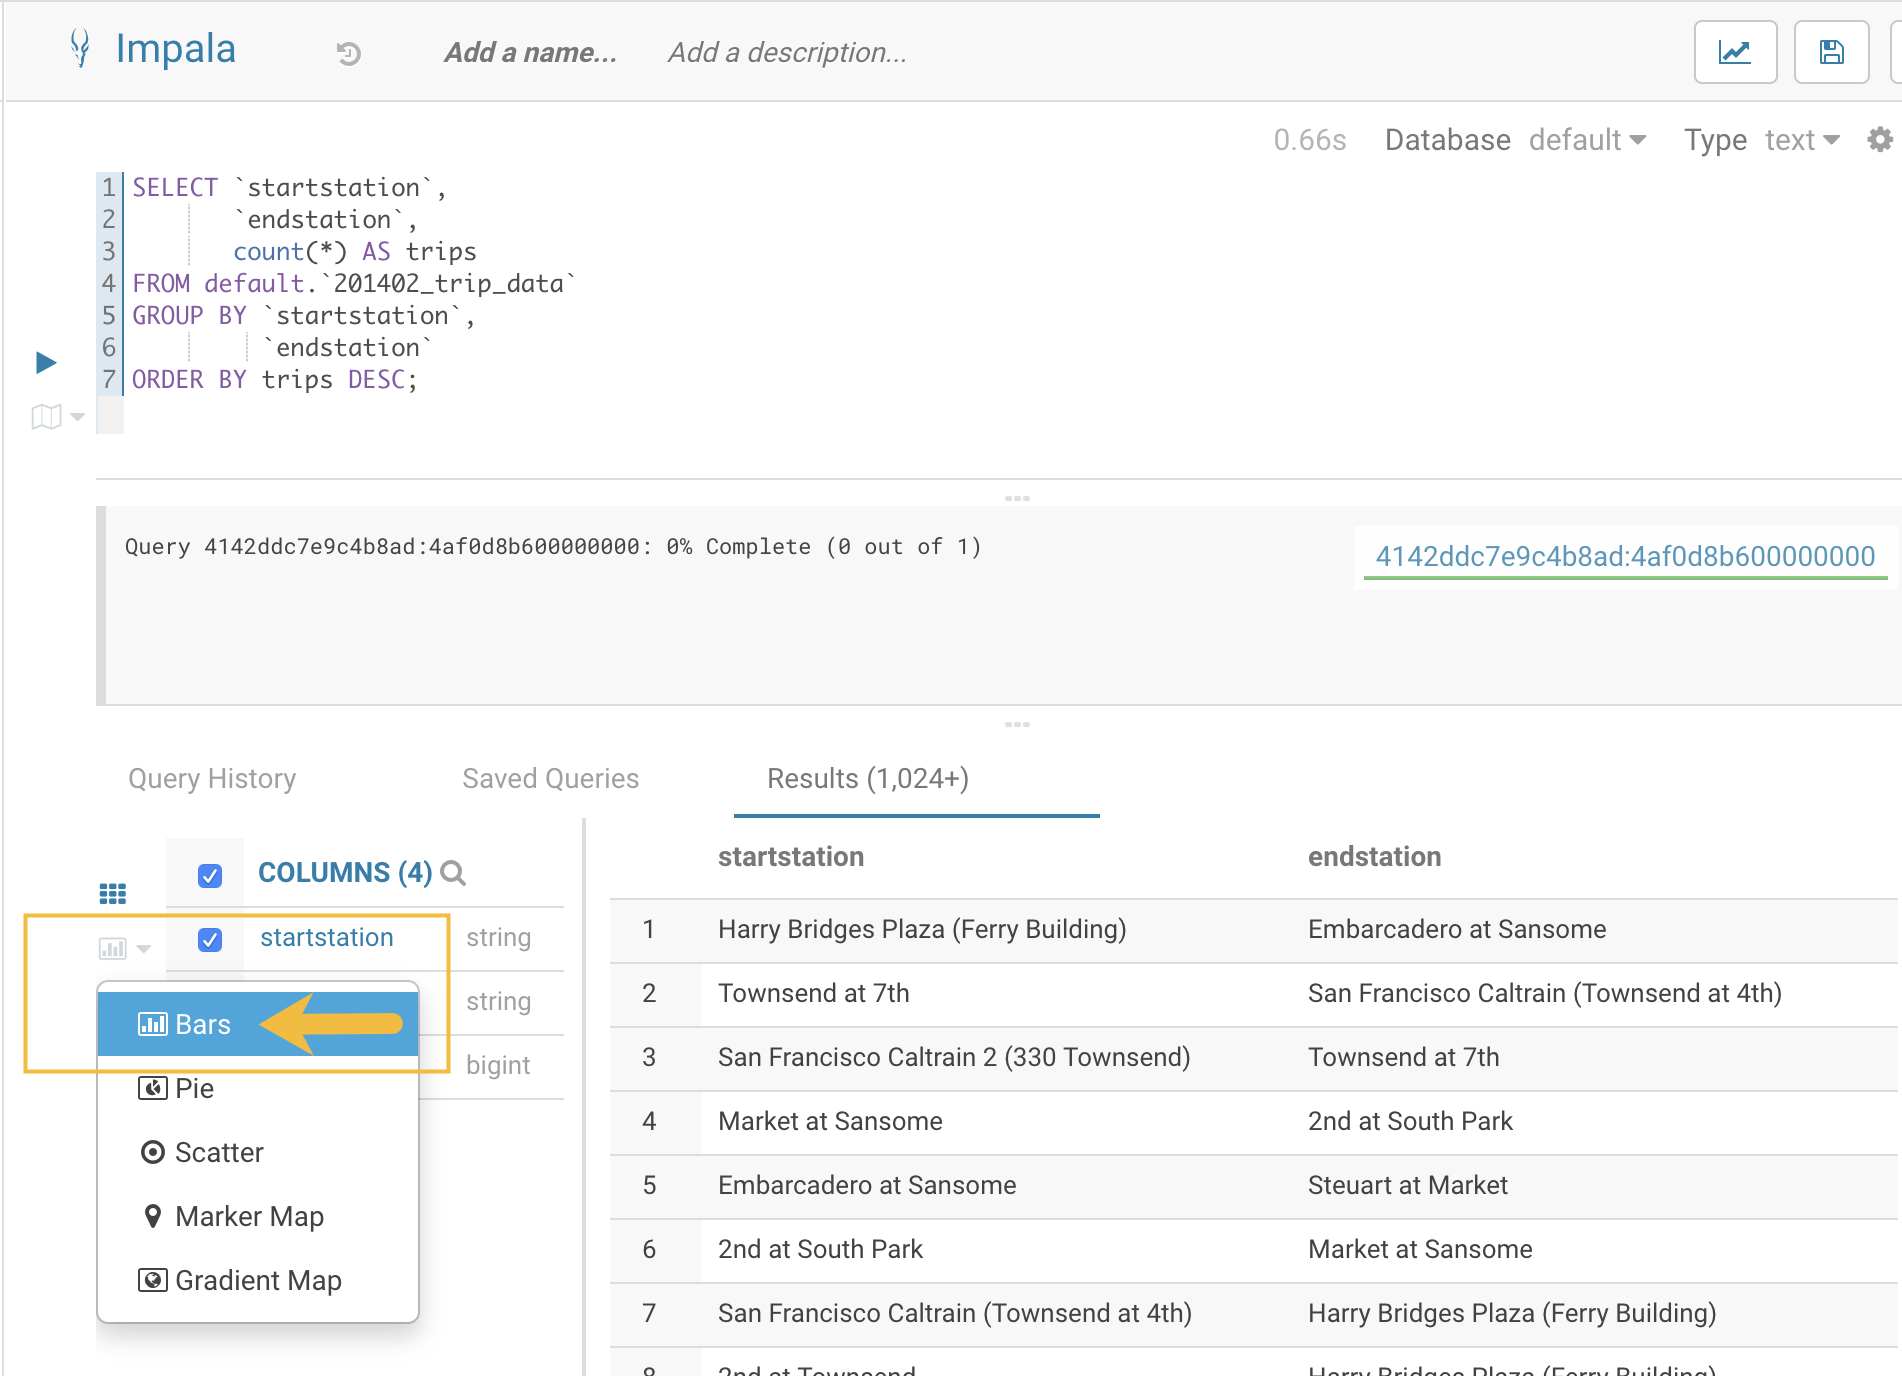
Create a bar chart that is based on the query results:
-
Click the chart icon
 and then select Bars.
-
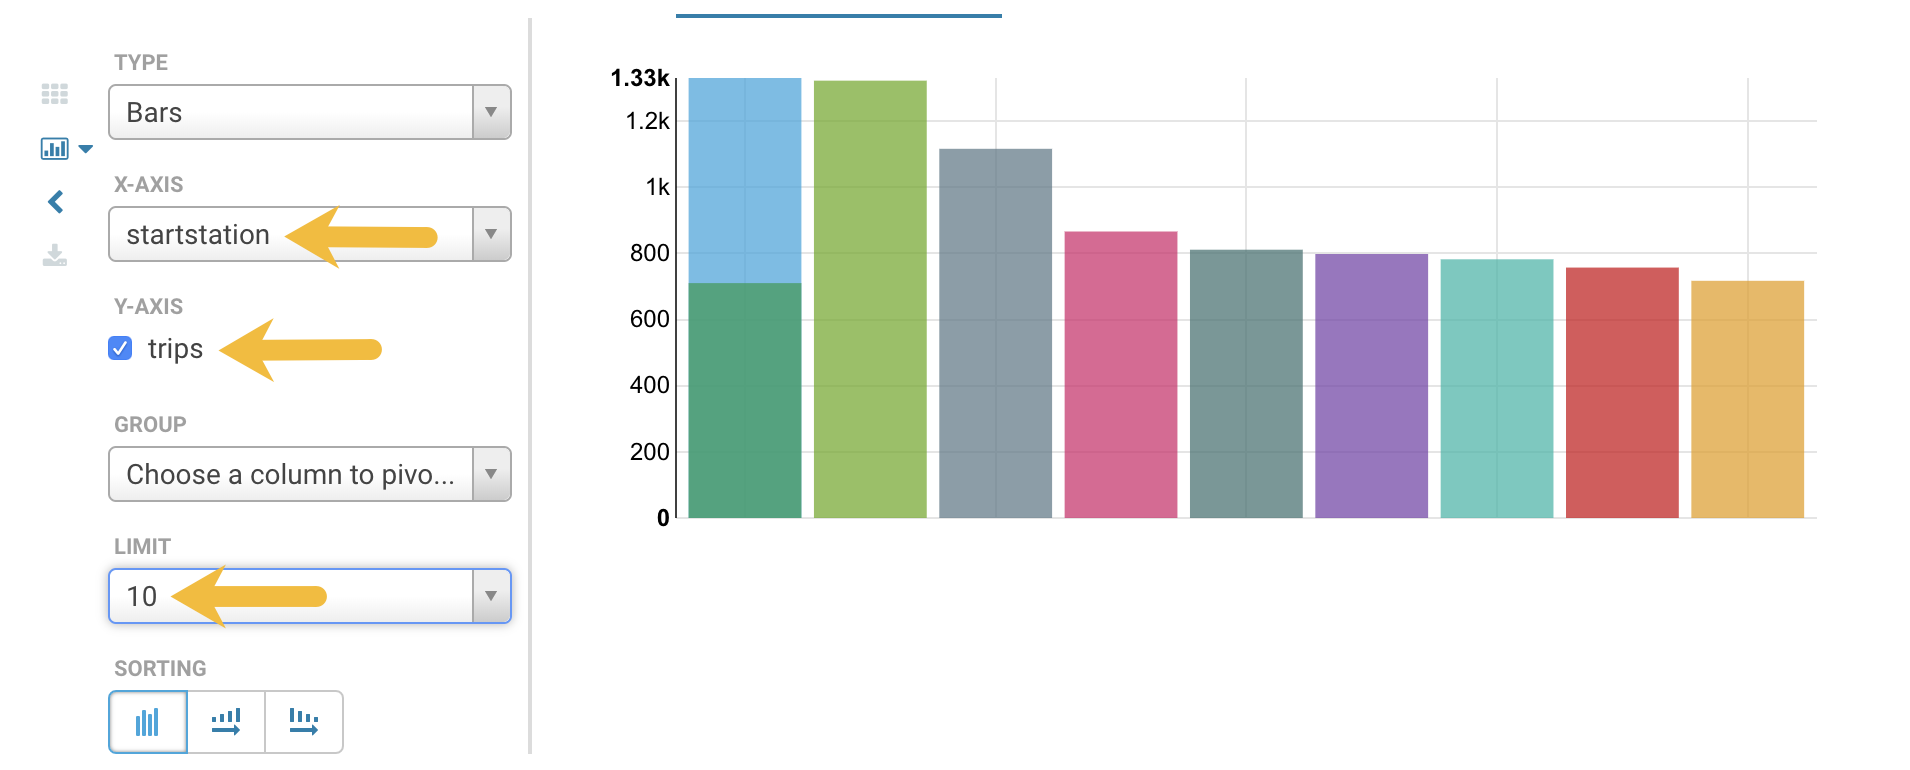
Set the bar chart elements as follows:
- X-AXIS = startstation
- Y-AXIS = trips
- LIMIT = 10
-
- Create a pie chart by clicking the chart icon again and then select Pie.
- Download the query results by clicking the download icon
 and selecting in what format you want to download, copy, or
export the results.
and selecting in what format you want to download, copy, or
export the results.
