How to Configure Resource Management for Impala
Impala includes features that balance and maximize resources in your CDH cluster. This topic describes how you can enhance a CDH cluster using Impala to improve efficiency.
A typical deployment uses the following.
Creating Static Service Pools
Use Static Service Pools to allocate dedicated resources for Impala and other services to allow for predictable resource availability.
Static service pools isolate services from one another, so that high load on one service has bounded impact on other services. You can use Cloudera Manager to configure static service pools that control memory, CPU and Disk I/O.
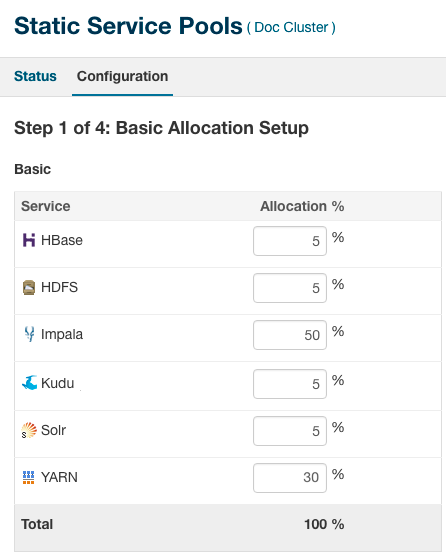
The following screenshot shows a sample configuration for Static Service Pools in Cloudera Manager:

-
HDFS always needs to have a minimum of 5-10% of the resources.
- Generally, YARN and Impala split the rest of the resources.
-
For mostly batch workloads, you might allocate YARN 60%, Impala 30%, and HDFS 10%.
-
For mostly ad hoc query workloads, you might allocate Impala 60%, YARN 30%, and HDFS 10%.
-
Using Admission Control
Within the constraints of the static service pool, you can further subdivide Impala's resources using Admission Control. You configure Impala Admission Control pools in the Cloudera Manager Dynamic Resource Pools page.
You use Admission Control to divide usage between Dynamic Resource Pools in multitenant use cases. Allocating resources judiciously allows your most important queries to run faster and more reliably.
Admission Control is enabled by default.
- Max Running Queries: Maximum number of concurrently executing queries in the pool before incoming queries are queued.
- Max Memory Resources: Maximum memory used by queries in the pool before incoming queries are queued. This value is used at the time of admission and is not enforced at query runtime.
- Default Query Memory Limit: Defines the maximum amount of memory a query can allocate on each node. This is enforced at runtime. If the query attempts to use more memory, it is forced to spill, if possible. Otherwise, it is cancelled. The total memory that can be used by a query is the MEM_LIMIT times the number of nodes.
- Max Queued Queries: Maximum number of queries that can be queued in the pool before additional queries are rejected.
- Queue Timeout: Specifies how long queries can wait in the queue before they are cancelled with a timeout error.
Setting Per-query Memory Limits
Use per-query memory limits to prevent queries from consuming excessive memory resources that impact other queries. Cloudera recommends that you set the query memory limits whenever possible.
If you set the Pool Max Mem Resources for a resource pool, Impala attempts to throttle queries if there is not enough memory to run them within the specified resources.
Only use admission control with maximum memory resources if you can ensure there are query memory limits. Set the pool Default Query Memory Limit to be certain. You can override this setting with the query option, if necessary.
Typically, you set query memory limits using the set MEM_LIMIT=Xg; query option. When you find the right value for your business case, memory-based admission control works well. The potential downside is that queries that attempt to use more memory might perform poorly or even be cancelled.
- Run the workload.
- In Cloudera Manager, go to .
- Click Select Attributes.
- Select Per Node Peak Memory Usage and click Update.
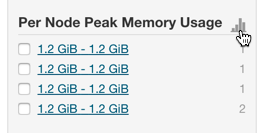
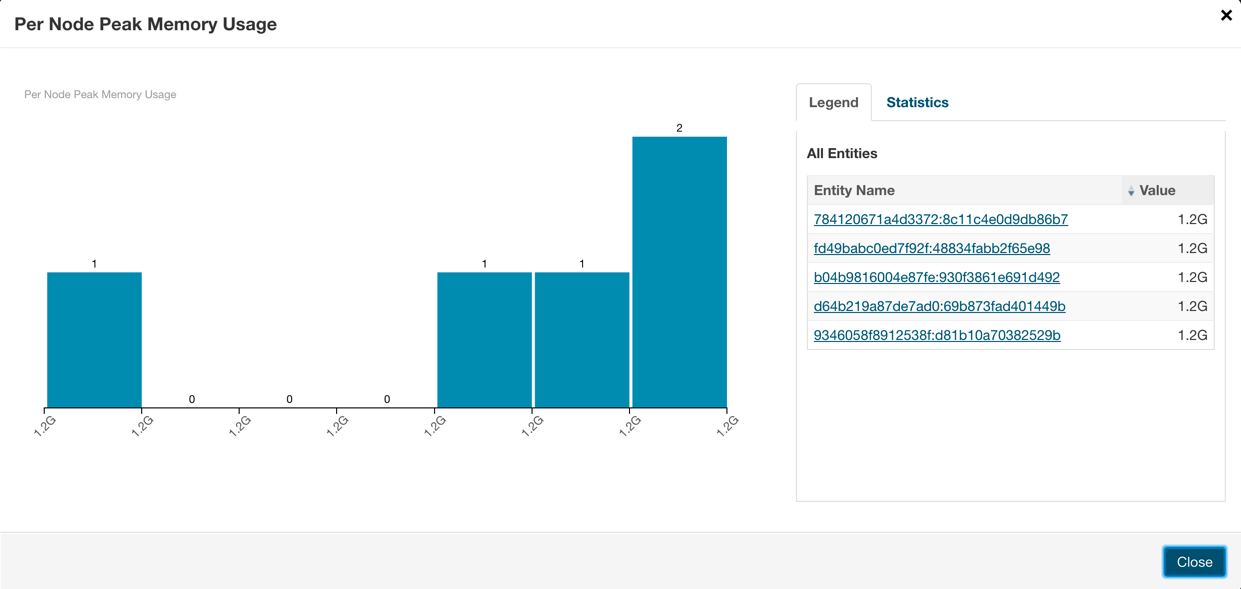
- Allow the system time to gather information, then click the Show Histogram icon to see the results.

- Use the histogram to find a value that accounts for most queries. Queries that require more resources than this limit should explicitly set the memory limit to ensure they can run to
completion.

Creating Dynamic Resource Pools
A dynamic resource pool is a named configuration of resources and a policy for scheduling the resources among Impala queries running in the pool. Dynamic resource pools allow you to schedule and allocate resources to Impala queries based on a user's access to specific pools and the resources available to those pools.
This example creates both production and development resource pools or queues. It assumes you have 3 worker nodes with 24GiB of RAM each for an aggregate memory of 72000MiB. This pool configuration allocates the Production queue twice the memory resources of the Development queue, and a higher number of concurrent queries.
To create a Production dynamic resource pool for Impala:
- In Cloudera Manager, select .
- Click the Impala Admission Control tab.
- Click Create Resource Pool.
- Specify a name and resource limits for the Production pool:
- In the Resource Pool Name field, enter Production.
- In the Max Memory field, enter 48000.
- In the Default Query Memory Limit field, enter 1600.
- In the Max Running Queries field, enter 10.
- In the Max Queued Queries field, enter 200.
- Click Create.
- Click Refresh Dynamic Resource Pools.
The Production queue runs up to 10 queries at once. If the total memory requested by these queries exceeds 48000 MiB, it holds the next query in the queue until the memory is released. It also prevents a query from running if it needs more memory than is currently available. Admission Control holds the next query if either Max Running Queries is reached, or the pool Max Memory limit is reached.
Here, Max Memory resources and Default Query Memory Limit throttle throughput to 10 queries, so setting Max Running Queries might not be necessary, though it does not hurt to do so. Most users set Max Running Queries when they cannot pick good numbers for memory. Since users can override the query option mem_limit, setting the Max Running Queries property might make sense.
To create a Development dynamic resource pool for Impala:
- In Cloudera Manager, select .
- Click the Impala Admission Control tab.
- Click Create Resource Pool.
- Specify a name and resource limits for the Development pool:
- In the Resource Pool Name field, enter Development.
- In the Max Memory field, enter 24000.
- In the Default Query Memory Limit field, enter 8000.
- In the Max Running Queries field, enter 1.
- In the Max Queued Queries field, enter 100.
- Click Create.
- Click Refresh Dynamic Resource Pools.
The Development queue runs one query at a time. If the total memory required by the query exceeds 24000 GiB, the query is rejected and not executed.
Understanding Placement Rules
Placement rules determine how queries are mapped to resource pools. The standard settings are to use a specified pool when specified; otherwise, use the default pool.
SET REQUEST_POOL=Production;
If you do not use a SET statement, queries are run in the default pool.
Setting Access Control on Pools
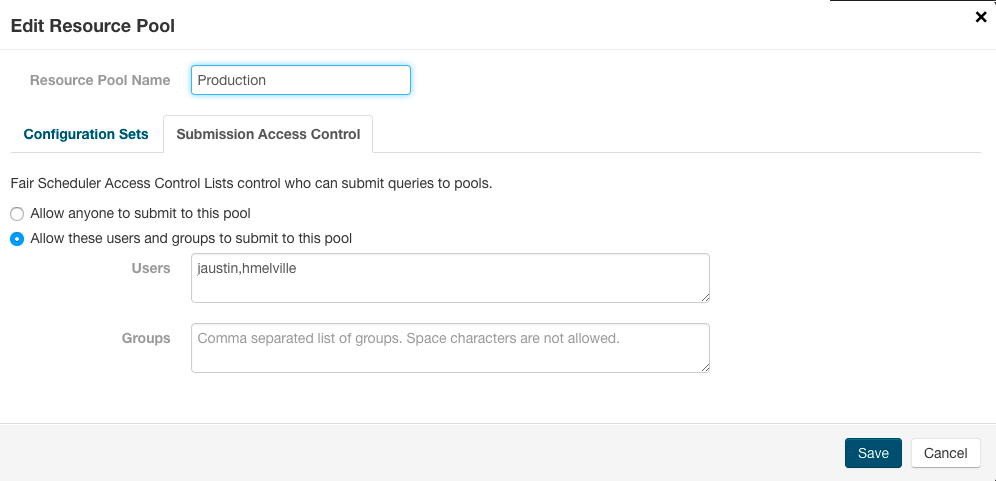
You can specify that only certain users and groups are allowed to use the pools you define.
To create a Development dynamic resource pool for Impala:
- In Cloudera Manager, select .
- Click the Impala Admission Control tab.
- Click the Edit button for the Production pool.
- Click the Submission Access Control tab.
- Select Allow these users and groups to submit to this pool.
- Enter a comma-separated list of users who can use the pool.

- Click Save.
Impala Resource Management Example
Anne Chang is administrator for an enterprise data hub that runs a number of workloads, including Impala.
Anne has a 20-node cluster that uses Cloudera Manager static partitioning. Because of the heavy Impala workload, Anne needs to make sure Impala gets enough resources. While the best configuration values might not be known in advance, she decides to start by allocating 50% of resources to Impala. Each node has 128 GiB dedicated to each impalad. Impala has 2560 GiB in aggregate that can be shared across the resource pools she creates.
Next, Anne studies the workload in more detail. After some research, she might choose to revisit these initial values for static partitioning.
- Large reporting queries executed by an external process/tool. These are critical business intelligence queries that are important for business decisions. It is important that they get the resources they need to run. There typically are not many of these queries at a given time.
- Frequent, small queries generated by a web UI. These queries scan a limited amount of data and do not require expensive joins or aggregations. These queries are important, but not as critical, perhaps the client tries resending the query or the end user refreshes the page.
- Occasionally, expert users might run ad-hoc queries. The queries can vary significantly in their resource requirements. While Anne wants a good experience for these users, it is hard to control what they do (for example, submitting inefficient or incorrect queries by mistake). Anne restricts these queries by default and tells users to reach out to her if they need more resources.
To set up admission control for this workload, Anne first runs the workloads independently, so that she can observe the workload’s resource usage in Cloudera Manager. If they could not easily be run manually, but had been run in the past, Anne uses the history information from Cloudera Manager. It can be helpful to use other search criteria (for example, user) to isolate queries by workload. Anne uses the Cloudera Manager chart for Per-Node Peak Memory usage to identify the maximum memory requirements for the queries.
- Large reporting queries use up to 32 GiB per node. There are typically 1 or 2 queries running at a time. On one occasion, she observed that 3 of these queries were running concurrently. Queries can take 3 minutes to complete.
- Web UI-generated queries use between 100 MiB per node to usually less than 4 GiB per node of memory, but occasionally as much as 10 GiB per node. Queries take, on average, 5 seconds, and there can be as many as 140 incoming queries per minute.
- Anne has little data on ad hoc queries, but some are trivial (approximately 100 MiB per node), others join several tables (requiring a few GiB per node), and one user submitted a huge cross join of all tables that used all system resources (that was likely a mistake).
Based on these observations, Anne creates the admission control configuration with the following pools:
XL_Reporting
| Property | Value |
|---|---|
| Max Memory | 1280 GiB |
| Default Query Memory Limit | 32 GiB |
| Max Running Queries | 2 |
| Queue Timeout | 5 minutes |
This pool is for large reporting queries. To support running 2 queries at a time, the pool memory resources are set to 1280 GiB (aggregate cluster memory). This is for 2 queries, each with 32 GiB per node, across 20 nodes. Anne sets the pool’s Default Query Memory Limit to 32 GiB so that no query uses more than 32 GiB on any given node. She sets Max Running Queries to 2 (though it is not necessary she do so). She increases the pool’s queue timeout to 5 minutes in case a third query comes in and has to wait. She does not expect more than 3 concurrent queries, and she does not want them to wait that long anyway, so she does not increase the queue timeout. If the workload increases in the future, she might choose to adjust the configuration or buy more hardware.
HighThroughput_UI
| Property | Value |
|---|---|
| Max Memory | 960 GiB (inferred) |
| Default Query Memory Limit | 4 GiB |
| Max Running Queries | 12 |
| Queue Timeout | 5 minutes |
This pool is used for the small, high throughput queries generated by the web tool. Anne sets the Default Query Memory Limit to 4 GiB per node, and sets Max Running Queries to 12. This implies a maximum amount of memory per node used by the queries in this pool: 48 GiB per node (12 queries * 4 GiB per node memory limit).
Notice that Anne does not set the pool memory resources, but does set the pool’s Default Query Memory Limit. This is intentional: admission control processes queries faster when a pool uses the Max Running Queries limit instead of the peak memory resources.
This should be enough memory for most queries, since only a few go over 4 GiB per node. For those that do require more memory, they can probably still complete with less memory (spilling if necessary). If, on occasion, a query cannot run with this much memory and it fails, Anne might reconsider this configuration later, or perhaps she does not need to worry about a few rare failures from this web UI.
With regard to throughput, since these queries take around 5 seconds and she is allowing 12 concurrent queries, the pool should be able to handle approximately 144 queries per minute, which is enough for the peak maximum expected of 140 queries per minute. In case there is a large burst of queries, Anne wants them to queue. The default maximum size of the queue is already 200, which should be more than large enough. Anne does not need to change it.
Default
| Property | Value |
|---|---|
| Max Memory | 320 GiB |
| Default Query Memory Limit | 4 GiB |
| Max Running Queries | Unlimited |
| Queue Timeout | 60 Seconds |
The default pool (which already exists) is a catch all for ad-hoc queries. Anne wants to use the remaining memory not used by the first two pools, 16 GiB per node (XL_Reporting uses 64 GiB per node, High_Throughput_UI uses 48 GiB per node). For the other pools to get the resources they expect, she must still set the Max Memory resources and the Default Query Memory Limit. She sets the Max Memory resources to 320 GiB (16 * 20). She sets the Default Query Memory Limit to 4 GiB per node for now. That is somewhat arbitrary, but satisfies some of the ad hoc queries she observed. If someone writes a bad query by mistake, she does not actually want it using all the system resources. If a user has a large query to submit, an expert user can override the Default Query Memory Limit (up to 16 GiB per node, since that is bound by the pool Max Memory resources). If that is still insufficient for this user’s workload, the user should work with Anne to adjust the settings and perhaps create a dedicated pool for the workload.