Access Lakehouse Optimizer UI

You can access the Lakehouse Optimizer page on "Cloudera on cloud Management Console". You can create Cloudera Lakehouse Optimizer policies, associate them with namespaces, and view the policy details in the Lakehouse Optimizer UI.

The following image shows the Lakehouse Optimizer page when you visit the page for the first time:
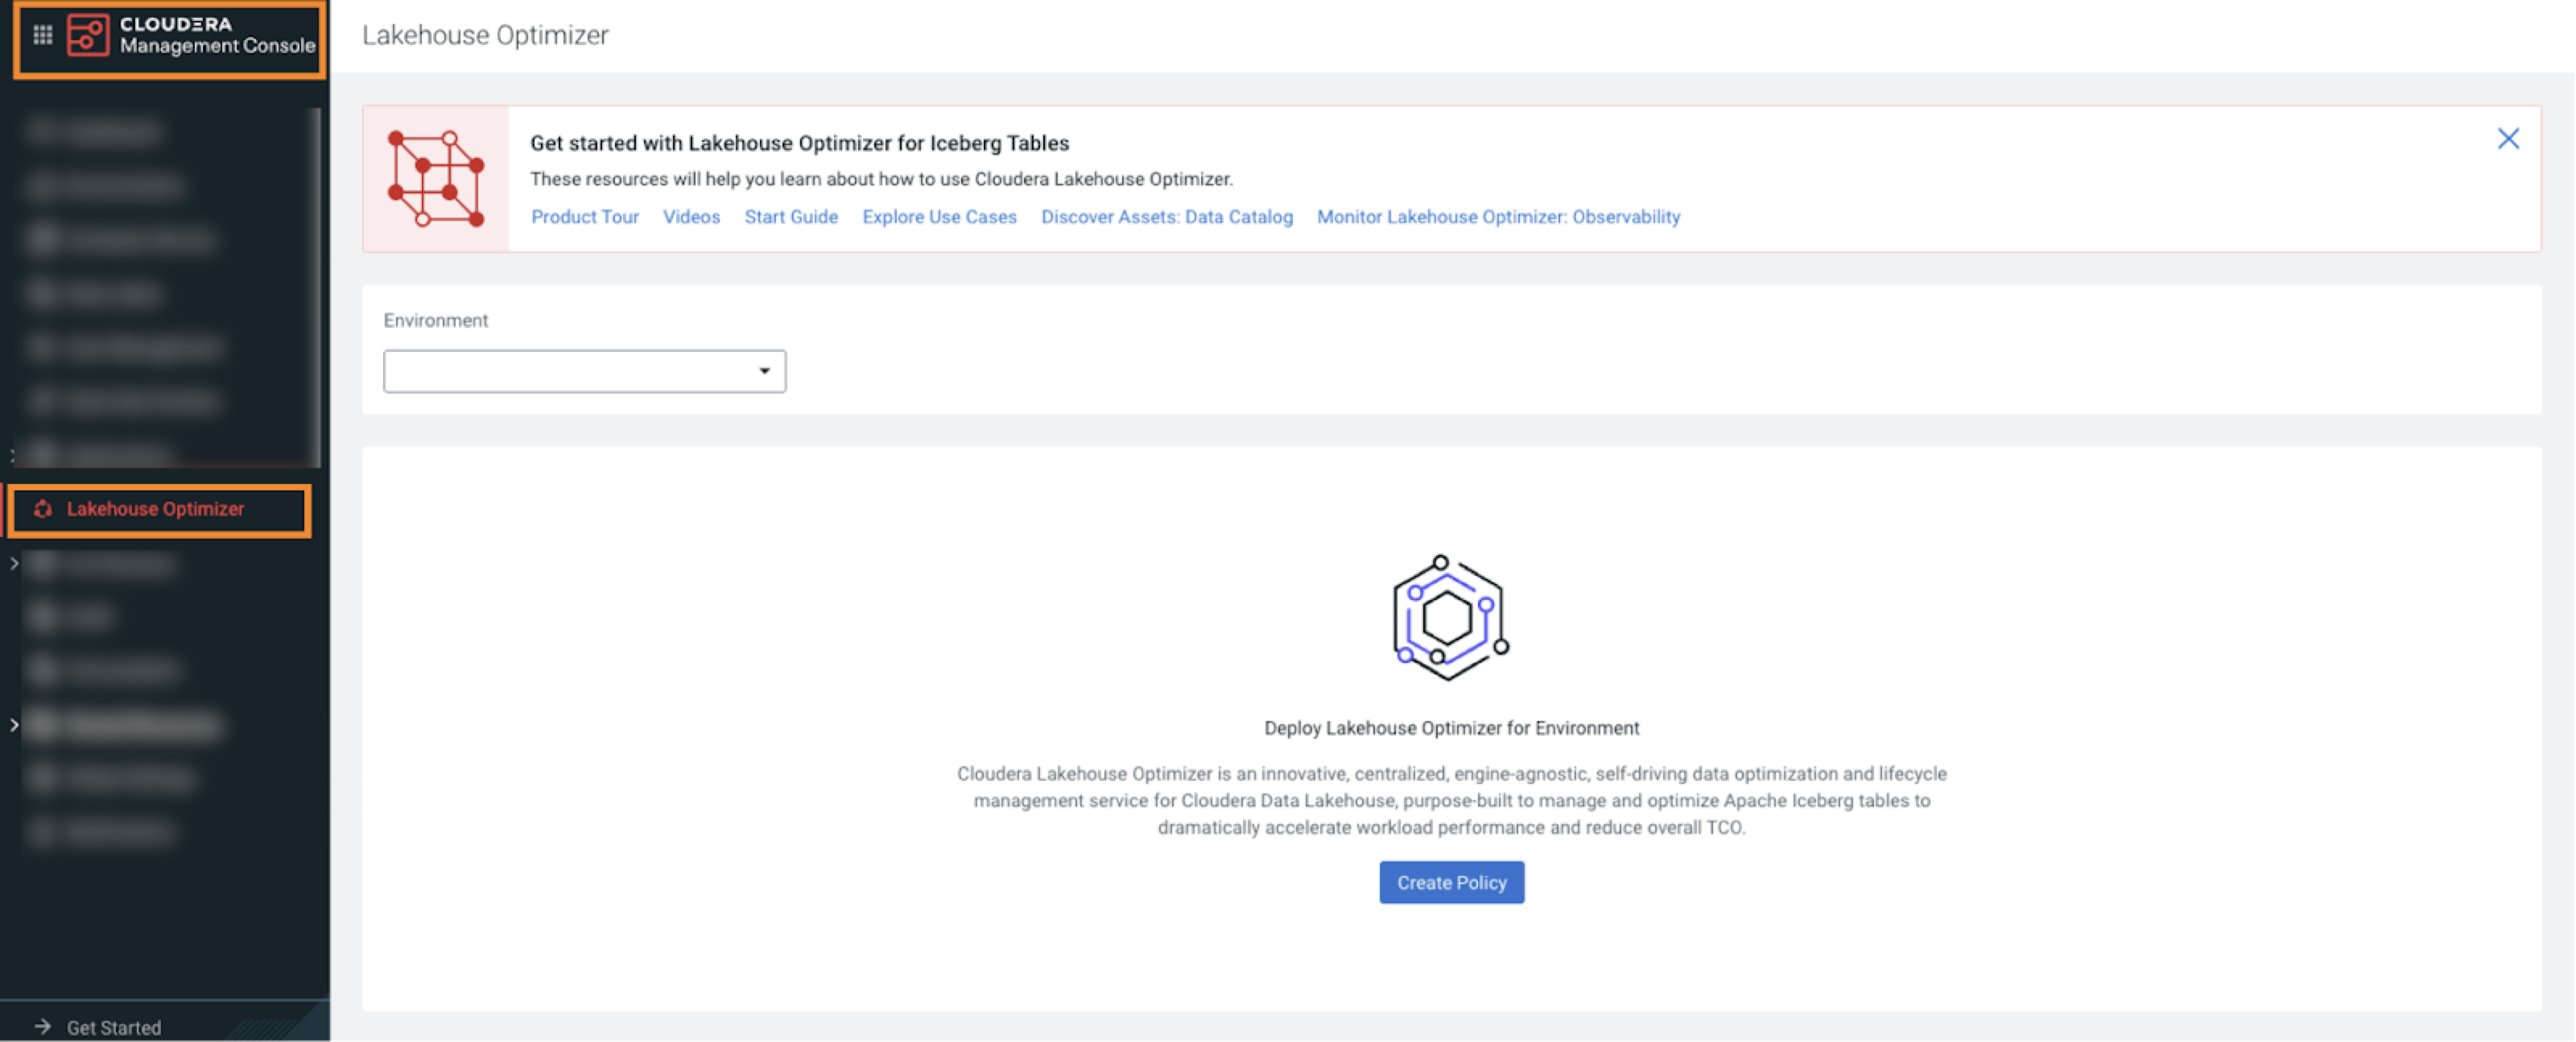
The image shows the Lakehouse Optimizer page when you visit the page for the first time.
When you access the Lakehouse Optimizer UI for the first time, the following elements appear:
  • Get Started banner – Provides links to various pages.
  • Environment – Choose the environment where you configured the Lakehouse Optimizer Data Hub. The current Status of the environment appears. Quick links to other services also appear.
After you choose an environment, the following elements appear:

Policies tab

The Policies tab shows the list of existing policies for the chosen environment. You can search for a policy, or filter the policies based on the Policy Status.

The following image shows the Policies tab on the Lakehouse Optimize page:
The image shows the Policies tab.

When you open the Policies tab for the first time, before you create a policy, the default policy named ClouderaAdaptive appears. Lakehouse Optimizer uses the default policy as a template to create the policies.

The Policies tab shows the following details:

  • The current Status icon for the table maintenance activity of the tables associated with the policy. For more information, see Status icons.
  • The Number of Tables that are associated with the policy.
  • The Number of Tasks or maintenance tasks that ran as a result of policy evaluation on the associated tables.
  • The Last Execution or the last policy run timestamp.
  • The icon for each policy shows the actions menu. Select the View action to see the policy details on the View Policy page.

Tables tab

The Tables tab shows the list of all the Iceberg tables in the selected namespace which includes the tables that are undergoing table maintenance and the tables that are in Pause state, and the table maintenance details. The namespaces that you declare for Cloudera Lakehouse Optimizer appear in the namespaces drop-down list. You can choose the required namespace to view the tables in it.

The following image shows the Tables tab on the Lakehouse Optimizer page where the tables in the default namespace are listed:
The image shows the Tables tab on the Lakehouse Optimize page.
The table details include:
  • The current table maintenance task Status icon. For more information, see Status icons.
  • The Table Name.
  • The Policies that the table is associated with.
  • The Last Execution timestamp for each table.

The following actions appear when you click for a table:

  • View Table Policies shows the list of policies associated with the table on the Table Policies side panel. The panel also appears when you click the table name on the Tables tab.
    The Table Policies side panel shows:
    • the table name and the list of policies it is associated with, and
    • the policy details which include the Policy Name, the Policy Status, the Number of Tasks that have run on the table, the Last Execution timestamp, and the Policy Actions.

      The Policy Actions shows the View Policy action which opens the View Policy page, and the Remove From Policy action which removes the table from the chosen policy.

      You can also click Edit Policy Associations to open the Edit Policy Associations modal window.

    The following image shows the Table Policies side panel:
    image shows the Table Policies side panel that appears when click View Tables Policies option.
  • Edit Policy Associations opens the Edit Policy Associations modal window. The option also appears on the Table Policies side panel.
    On the Edit Policy Associations modal window, you can perform the following actions:
    • Select one or more policies to associate with the table.
    • Remove the associations from the table.
    • Search for the available policies that you want to create associations with the table,
    • Search for the policies that are already associated with the table.
    • Save the changes.
    The following image shows the Edit Policy Associations modal window:
    The image shows the Edit Policy Associations modal window.
  • Pause Table pauses the maintenance tasks that are scheduled to be run on the table. You can click Unpause Table later on when required.
Status icon descriptions:
Status icon Status description
Appears when the last policy run for the table completed successfully.
Appears when the last policy run for the table failed.
Appears when one of the following conditions is true:
  • You paused the table maintenance.
  • Cloudera Lakehouse Optimizer paused the table maintenance because the recurring failures during the execution phase for the policy exceeded the retry value. For instructions about setting the retry value, see Pause and resume table maintenance.
Appears when no tasks have run on the table.