Monitoring Clusters
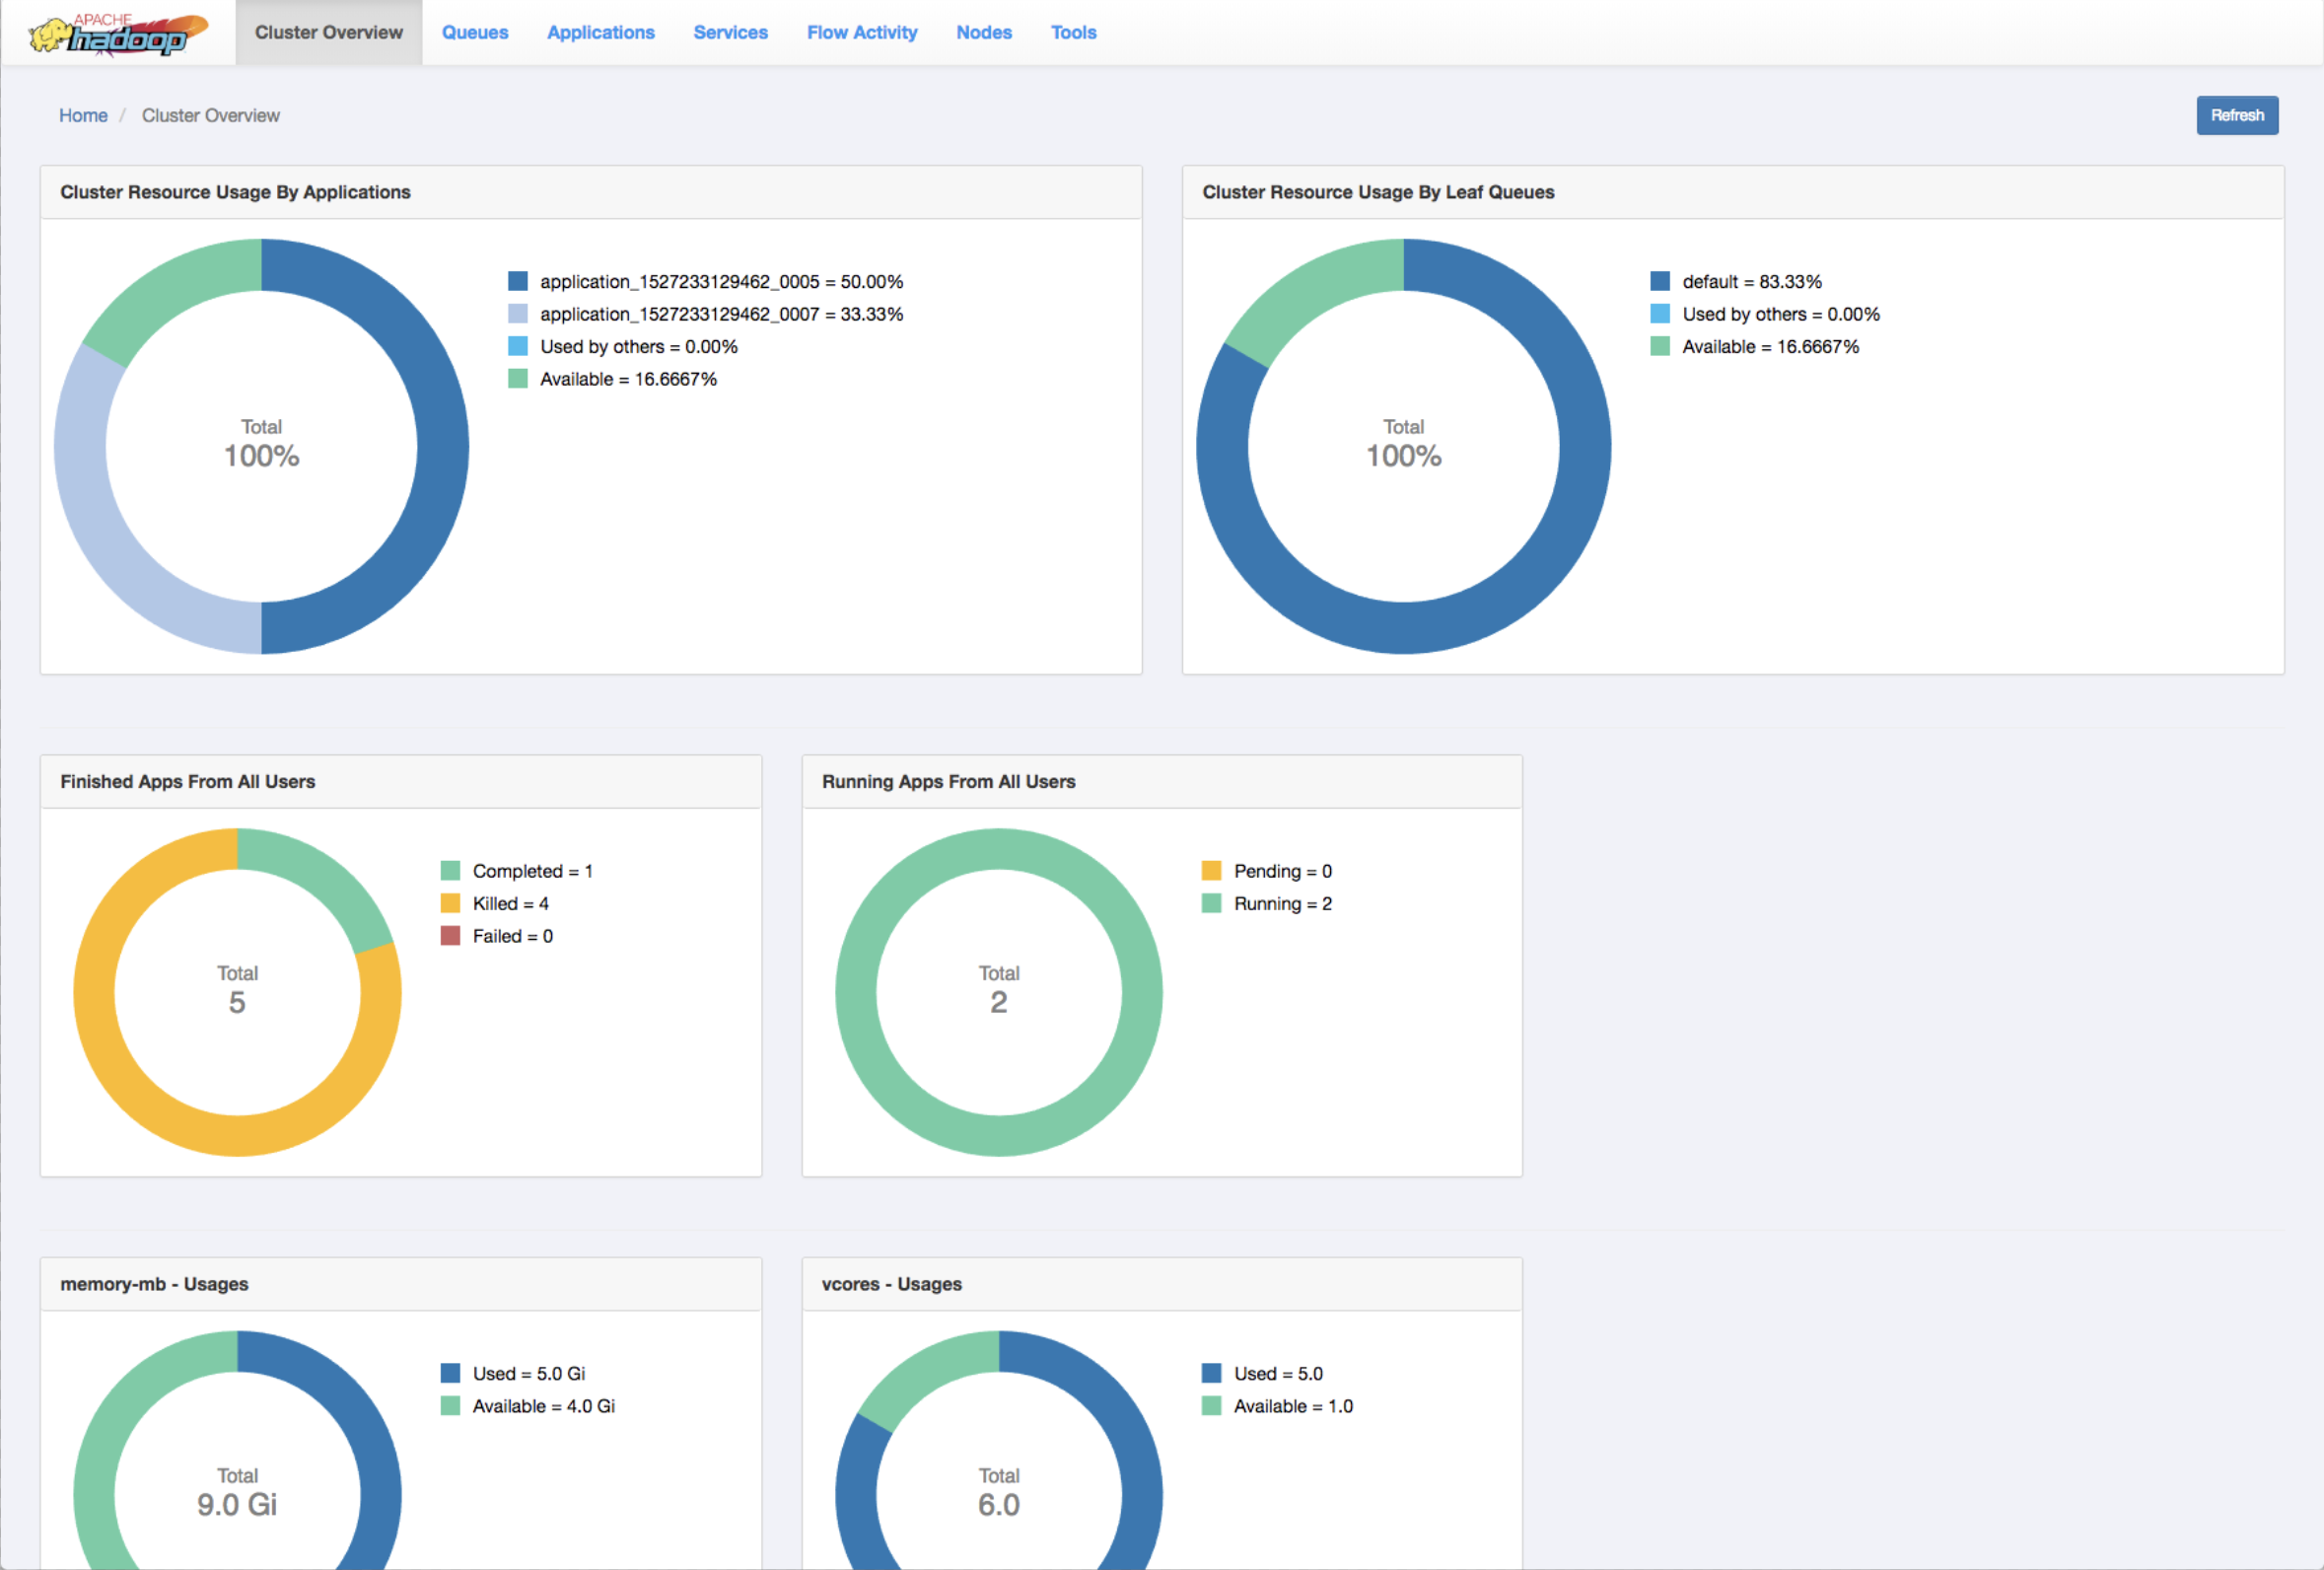
The Cluster Overview page shows cluster resource usage by applications and queues, information about finished and running applications, and usage of memory and vCores in the cluster.

- Cluster Resource Usage by Applications
- Displays the percentage of cluster resources in use by applications and the percentage available for usage.
- Cluster Resource Usage by Leaf Queues
- Displays the percentage of cluster resources in use by leaf queues and the percentage available for usage.
- Finished Apps From All Users
- Displays the number of completed, killed, and failed applications.
- Monitor Running Apps
- Displays the number of pending and running applications.
- memory-mb - Usages
- Displays the amount of used and available memory.
- vcores - Usages
- Displays the number of used and available virtual cores.
- Monitor Node Managers
Displays the status of the Node Managers under the following categories:
- Active
- Unhealthy
- Decommissioning
- Decommissioned

