Viewing DAG information for a Hive query
Directed Acyclic Graph (DAG) is created by the Hive engine every time you query the Hive Virtual Warehouse. The Hive SQL queries are compiled and converted into a Tez execution graph also known as a DAG. DAG is a collection of vertices where each vertex executes a fragment of the query or script. Hue provides a web interface to view detailed information about DAGs.
Directed connections between vertices determine the order in which they are executed. For example, the vertex to read a table must be run before a filter can be applied to the rows of that table. As another example, consider a vertex that reads a user table that is very large and distributed across multiple computers and multiple racks. Reading the table is achieved by running many tasks in parallel.
-
Click DAG Info to see the DAG ID, DAG name, the status
of the query, the time taken to execute the DAG, start time, and end time.
The following image shows the DAG Info tab on the Hue web interface:
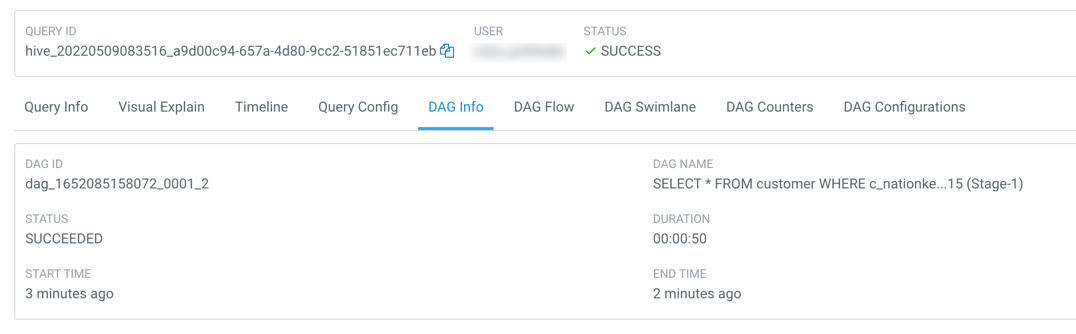
The following table lists and describes the status of the Tez job:Status Description Submitted The DAG is submitted to Tez but is not running Running The DAG is currently running Succeeded The DAG was completed successfully Failed The DAG failed to complete successfully Killed The DAG was stopped manually Error An internal error occurred when executing the DAG -
Click DAG Flow to see the DAG in the form of a
flowchart.
You can gain insight into the complexity and the progress of executing jobs, and investigate the vertices that have failures or are taking a long time to complete.The following image shows the DAG Flow tab on the Hue web interface::
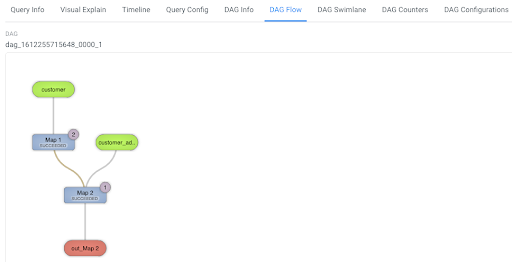
Here, the input to vertices Map 1 and Map 2 are the tables displayed in green boxes. Next, Map 2 depends on the result set generated by Map 1. Map 2 is the last vertex in the DAG flow and after it completes its execution, the query output is written to a file in a filesystem such as S3 or ABFS.There are a few options to change the layout of the DAG flow. You can hide the input and the output nodes to view only the task vertices by clicking the Toggle source/sink visibility button. You can switch between the horizontal and vertical orientation by clicking the Toggle orientation button. -
Click DAG Swimlane to see the DAG of the vertices
against time.
Each mapping and reducing task is a vertex. Each horizontal bar of the swimlane represents the total time taken by the vertex to complete the execution. The vertical lines indicate the time when the vertex was initialized, the time when the vertex started, the time when the first task started, the time when the last task was completed, and the time when the vertex finished its execution. When you mouse over the vertical line, the bubble displays the stage of the vertex execution and provides a timestamp. The vertical lines connecting two vertices denote the dependency of a vertex on another vertex.The following image shows the DAG Swimlane tab on the Hue web interface:
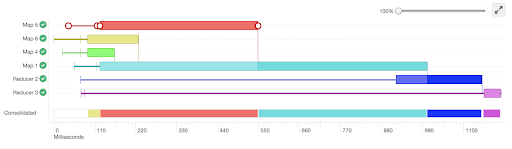
In this example, Map 1 depends on the results of Map 5. Map 1 will finish its execution only when Map 5 finishes its execution successfully. Similarly, Reducer 2 depends on Map 1 to complete its execution.The consolidated timeline shows the percentage of time each vertex took to complete executing. -
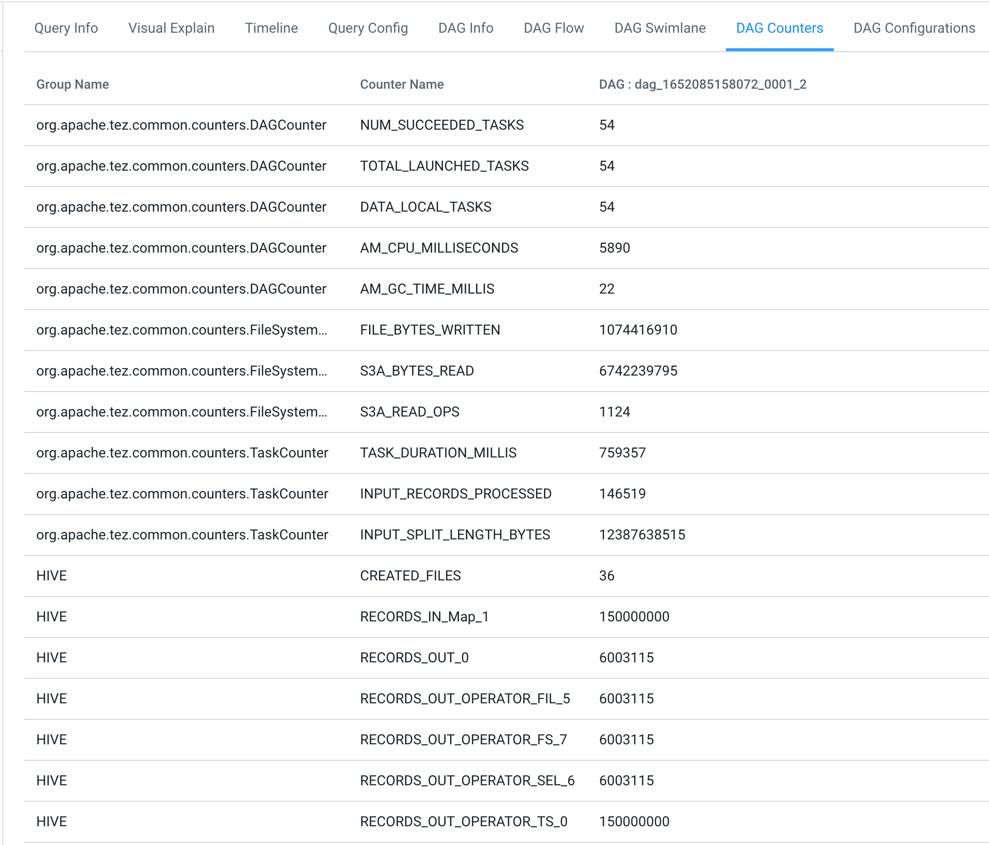
Click DAG Counters to see details such as the number of
bytes read and written, number of tasks that initiated and ran successfully,
amount of CPU and memory consumed, and so on.
The DAG Counters tab provides a way to measure the progress or the number of operations that occur within a generated DAG. Counters are used to gather statistics for quality control purposes or problem diagnosis.The following image shows the DAG Counters tab on the Hue web interface:
-
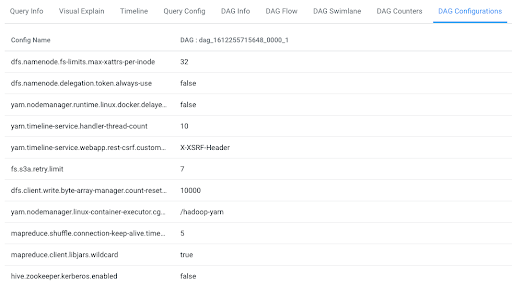
Click DAG Configurations to see the Tez configuration
details for a query that has a DAG associated with it.
The following image shows the DAG Configurations tab on the Hue web interface: