

3.3. Understanding How Your Tez Job Is Executed
The Tez View enables you to gain insight into the complexity and the progress of executing jobs.
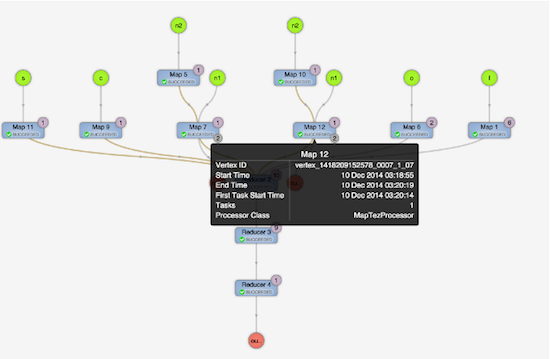
The View tab shows the following:
DAG graphical view
All vertices
Tasks per vertex on top right of the vertex
Failed vertices display in red, successful vertices display in green
Mouse over vertices to view timeline details
The View Tab enables you to investigate the vertices that have failures or are taking a long time.