
Accessing the CEM UI
After you start the EFM server, you can bring up the CEM User Interface (UI) in order to build, edit, and publish dataflows. You can also monitor the EFM server and agent events by accessing the CEM UI.
To get started, open a web browser and navigate to
http://<hostname>:10080/efm/ui. The port can be changed by editing the
efm.properties file in the EFM conf directory, but the default port is
10080.
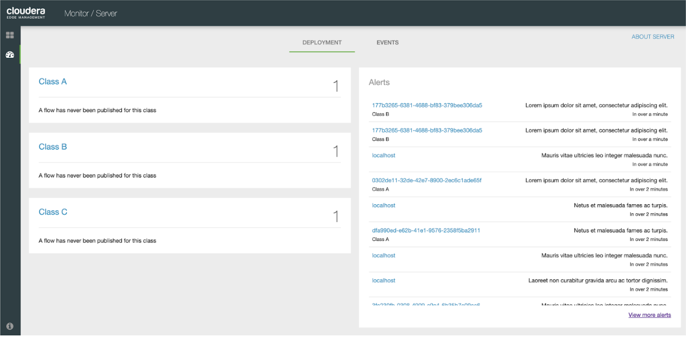
The first column, from the left, displays the classes available in the system. The classes allow you to create a single configuration template for multiple agents.
The Alerts column displays the alerts available in the system. To view more alerts, click the View more alerts link.
To fetch details about the C2 server, click the About Server link. The
About This Server dialog displays the server URL, registry URL, registry bucket
ID, and registry bucket name.
