
Analyzing the Details of Hive Queries
Click the relevant link in the Query ID column for a query that you want to investigate. A window with three tabs containing information about the query is displayed.
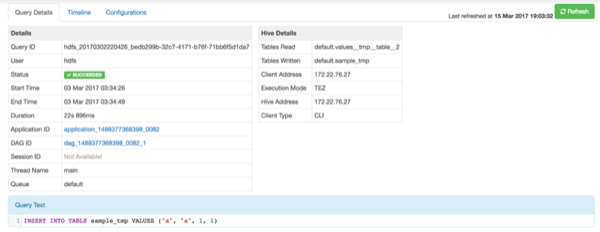
Details Tab
The Details tab, the first of the three tabs, is displayed after clicking a Query ID link.
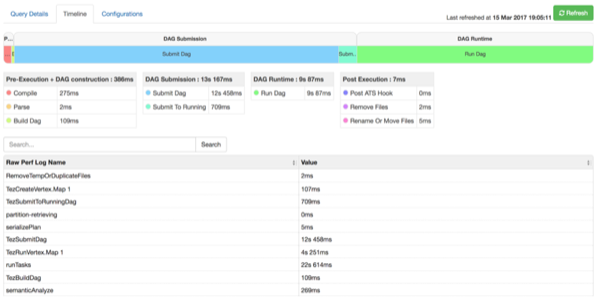
Total Timeline View
Click the Timeline tab to get a visual representation of Hive performance logs. The view represents the following pre-execution, runtime, and post-execution phases of a query:
Pre-execution and DAG construction
DAG submission
DAG runtime
Post-execution
Duration data about each phase are distilled into more granular metrics based on query execution logs.
A search-enabled table with raw performance log names and their major values is displayed under the timeline visualization.
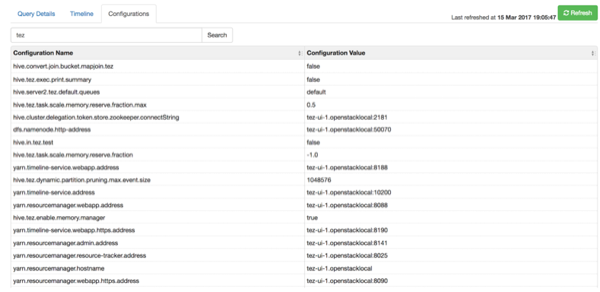
Configurations Tab
Click the Configurations tab to see a list of configuration properties and settings that are used in the Hive query. You can use this tab to verify that configuration property values align with your expectations.
![[Tip]](../common/images/admon/tip.png) | Tip |
|---|---|
By default, only configuration property names that contain the substring
|