

Monitoring Topology Status: the Topology Summary Page
The topology summary page contains metrics and directed acyclic graphs (DAG) that show deployed topology components and topology debugging features.
You can select which window for which to review metrics. By default the view will show metrics for "All Time."
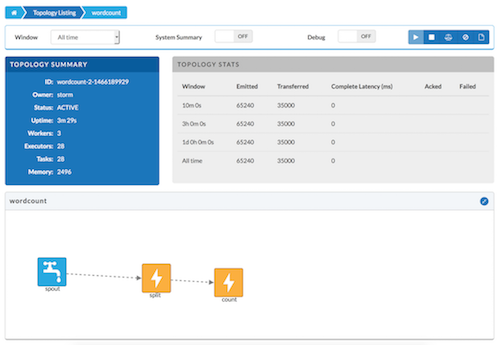
On the right side above panel, there are several topology actions buttons. These buttons allow you to perform several actions: Activate (highlights when topology status is deactivated), Deactivate, Rebalance, Kill, and Changing log level.

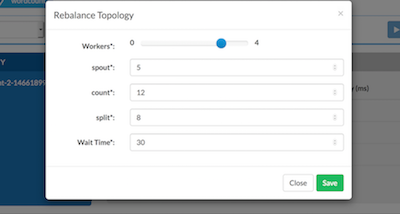
Rebalancing a Topology
To adjust the number of workers for the topology and the parallelism of each component in the topology, use the rebalance button.
Changing the Logging Level of a Running Topology
This feature facilitates topology debugging, by allowing you to temporarily enable debug log level and see any issues in a topology.
To use this feature, edit the Logger to update the class name for which you would like to add a log level.
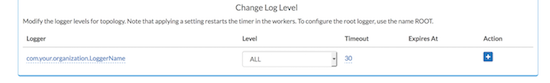
For example, if you would like to see debug logs in the count bolt of the
sample word count topology supplied with Storm, add the classname as
org.apache.storm.starter.WordCount.
Sampling Events in a Running Topology
This feature allows users to debug and see the events that are flowing through the topology, essentially sampling events from a running topology and storing them in a log file.
To use this feature, turn the Debug switch to "On":

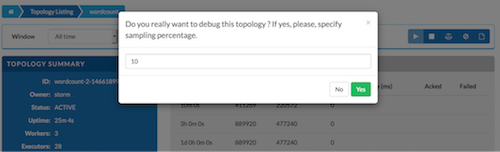
The event logger will sample the given percentage of incoming tuples and write them to the log for users to see the incoming tuples at each stage of topology. We recommend that you not set this to a higher percentage, because it can fill up the logs on disk very quickly.