Hortonworks Docs
»
using ambari core services 2.7.1
»
Using Ambari Core Services
Also available as:
Using Ambari Core Services
Understanding Ambari Metrics Service
Access Grafana
View Grafana dashboards
View selected metrics in a Grafana dashboard
View metrics for selected hosts
Grafana dashboards reference
AMS HBase dashboards
AMS HBase Home
AMS HBase RegionServers
AMS HBase Misc
Ambari dashboards
Ambari Server database
Ambari Server JVM
Ambari Server top n
Druid Dashboards
Druid Home
Druid Ingestion
Druid Query
HDFS Dashboards
HDFS Home
HDFS NameNodes
HDFS DataNodes
HDFS top n
HDFS Users
YARN Dashboards
YARN Home
YARN Applications
YARN MR JobHistory Server
YARN NodeManagers
YARN Queues
YARN ResourceManager
YARN TimelineServer
Hive Dashboards
Hive Home
Hive HiveMetaStore
Hive HiveServer2
Hive LLAP Dashboards
Hive LLAP Heatmap
Hive LLAP Overview
Hive LLAP Daemon
HBase Dashboards
HBase Home
HBase RegionServers
HBase Misc
HBase Tables
HBase Users
Kafka Dashboards
Kafka Home
Kafka Hosts
Kafka Topics
Storm Dashboards
Storm Home
Storm Topology
Storm Components
System Dashboards
System Home
System Servers
NiFi Dashboard
NiFi Home
Tuning performance for AMS
Customize the AMS collector mode
Customize AMS TTL settings
Customize AMS memory settings
Customize AMS environment specific settings for a cluster
Move the AMS metrics collector
Enable specific HBase metrics
Setting up AMS security
Change the Grafana admin password
Set up https for Grafana
Set up https for AMS
Understanding Ambari log search
Install Log Search
Access log search UI
View logs for background operations
View logs for each host
View service logs
View audit logs
Understanding Ambari Infra
Operation Modes
Connect to Solr
Record schema
Extract records
Write data to HDFS
Write data to S3
Write data locally
Example delete indexed data
Example archive indexed data
Example save indexed data
Example analyze archived, indexed data with Hive
Example Hadoop logs
Example audit logs
Example HDFS audit logs
Example Ambari audit logs
Example Ranger audit logs
Tuning performance for Ambari Infra
Tuning your operating system for use with Solr
Tuning JVM settings for Solr
Tuning GC settings for Solr
Tuning environment specific parameters
Adding new shards for Solr
Reindexing data to reduce Solr out of memory exception errors
Access Grafana
Use the Grafana user interface to view metrics visualizations.
In
Ambari Web
, browse to
Services
>
Ambari Metrics
>
Summary
.
In
Quick Links
, click
Grafana
.
A read-only version of the Grafana interface opens in a new tab in your browser.
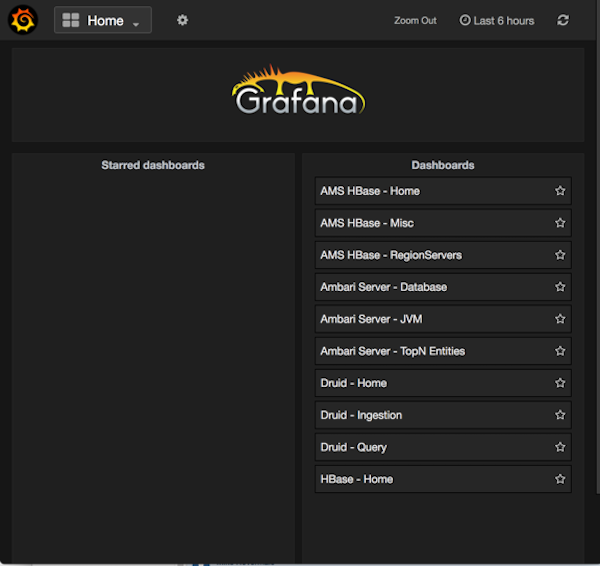
In the Grafana UI, click a link in the
Dashboards
list, or click the
Home
link.
Parent topic:
Understanding Ambari Metrics Service
Related information
http://grafana.org/
© 2012–2019, Hortonworks, Inc.
Document licensed under the
Creative Commons Attribution ShareAlike 4.0 License
.
Hortonworks.com
|
Documentation
|
Support
|
Community