Use the following commands to collect information about a Windows based cluster. This data helps to isolate specific deployment issues.
Collect OS information: This data helps to determine if HDP is deployed on a supported operating system (OS).
To list the operating system, run the following command in PowerShell as an Administrator user:
(Get-WmiObject -class Win32_OperatingSystem).Caption Microsoft Windows Server 2012 Standard
To list the OS version for your host machine, enter:
[System.Environment]::OSVersion.Version
Determine installed softwareThis data can be used to troubleshoot performance issues or unexpected behavior for a specific node in your cluster. For example, unexpected behavior might be a situation where a MapReduce job runs for a longer duration than expected.
To see the list of installed software on a particular host machine, go to
Control Panel -> All Control Panel Items -> Programs and Features.Detect running processes: This data can be used to troubleshoot either performance issues or unexpected behavior for a specific node in your cluster.
You can either press
CTRL+SHIFT+DELon the affected host machine, or you can execute the following command on PowerShell as an Administrator user:tasklist
Detect Java running processes: Use this command to verify the Hadoop processes running on a specific machine.
As
HADOOP_USER, execute the following command on the affected host machine:su $HADOOP_USER jps
You should see the following output:
988 Jps
2816 -- process information unavailable
2648 -- process information unavailable
1768 -- process information unavailable
No actual name is given to any process. Ensure that you map the process IDs (pid) from the output of this command to the
.wrapperfile within thec:\hdp\hadoop-1.1.0-SNAPSHOT\bindirectory.![[Note]](../common/images/admon/note.png)
Note Ensure that you specify the complete path to the Java executable, if the Java bin directory's location is not set within your
PATH.Detect Java heap allocation and usage: Use the following command to list Java heap information for a specific Java process. This data can be used to verify the heap settings and thus analyze whether a specific Java process is reaching the threshold.
Execute the following command on the affected host machine:
jmap -heap pid_of_Hadoop_process
You should see output similar to the following:
C:\hdp\hadoop-1.1.0-SNAPSHOT>jmap -heap 2816
Attaching to process ID 2816, please wait...
Debugger attached successfully.
Server compiler detected.
JVM version is 20.6-b01

using thread-local object allocation.
Mark Sweep Compact GC

Heap Configuration:
 MinHeapFreeRatio = 40
 MaxHeapFreeRatio = 70
 MaxHeapSize = 4294967296 (4096.0MB)
 NewSize = 1310720 (1.25MB)
 MaxNewSize = 17592186044415 MB
 OldSize = 5439488 (5.1875MB)
 NewRatio = 2
 SurvivorRatio = 8
 PermSize = 21757952 (20.75MB)
 MaxPermSize = 85983232 (82.0MB)

Heap Usage:
New Generation (Eden + 1 Survivor Space):
 capacity = 10158080 (9.6875MB)
 used = 4490248 (4.282234191894531MB)
 free = 5667832 (5.405265808105469MB)
 44.203707787298384% used
Eden Space:
 capacity = 9043968 (8.625MB)
 used = 4486304 (4.278472900390625MB)
 free = 4557664 (4.346527099609375MB)
 49.60548290307971% used
From Space:
 capacity = 1114112 (1.0625MB)
 used = 3944 (0.00376129150390625MB)
 free = 1110168 (1.0587387084960938MB)
 0.35400390625% used
To Space:
 capacity = 1114112 (1.0625MB)
 used = 0 (0.0MB)
 free = 1114112 (1.0625MB)
 0.0% used
tenured generation:
 capacity = 55971840 (53.37890625MB)
 used = 36822760 (35.116920471191406MB)
 free = 19149080 (18.261985778808594MB)
 65.7880105424442% used
Perm Generation:
 capacity = 21757952 (20.75MB)
 used = 20909696 (19.9410400390625MB)
 free = 848256 (0.8089599609375MB)
 96.10139777861446% used
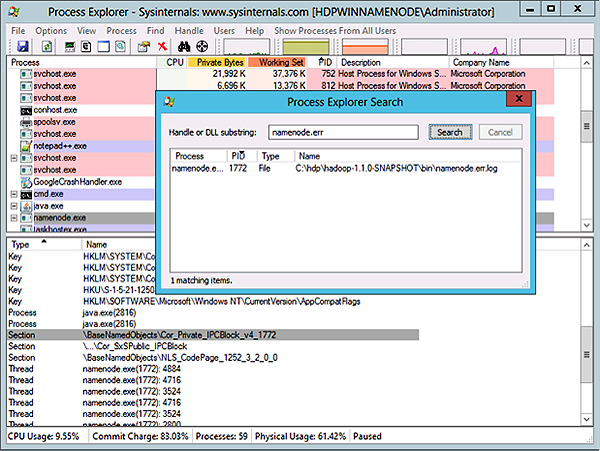
Show open files: Use Process Explorer to determine which processes are locked on a specific file. For information on how to use Process Explorer, see Windows Sysinternals - Process Explorer.
For example, you can use Process Explorer to troubleshoot the file lock issues that prevent a particular process from starting, as shown in the following screen shot:
Verify well-formed XML:
Ensure that the Hadoop configuration files (for example, hdfs-site.xml, etc.) are well formed. You can either use Notepad++ or third-party tools like Oxygen, XML Spy, etc., to validate the configuration files. Here are instructions for Notepad++:
Open the XML file to be validated in Notepad++ and select
XML Tools -> Check XML Syntax.Resolve validation errors, if any.
Detect AutoStart Programs: This information helps to isolate errors for a specific host machine.
For example, a potential port conflict between auto-started process and HDP processes, might prevent launch for one of the HDP components.
Ideally, the cluster administrator must have the information on auto-start programs handy. Use the following command to launch the GUI interface on the affected host machine:
c:\Windows\System32\msconfig.exe
Click
Startup. Ensure that no start-up items are enabled on the affected host machine.Create a list of all mounts on the machine: This information determines the drives that are actually mounted or available for use on the host machine. To troubleshoot disk capacity issues, use the following PowerShell command to determine if the system is violating any storage limitations:
Get-VolumeYou should see output similar to the following:
Drive       FileSystem FileSystem DriveType HealthStatus Size     Remaining
Letter      Label                                                 Size
----------- ---------- ---------- --------- ------------ -------- -------------
System      Reserved   NTFS       Fixed     Healthy      108.7 MB 350 MB
C                      NTFS       Fixed     Healthy      10.74 GB 19.97 GB
D           HRM_SSS... UDF        CD-ROM    Healthy      0 B      3.44 GB
Operating system messages: Use
Event
            Viewer
to detect messages with a system or an application.Event Viewer can determine if a machine was rebooted or shut down at a particular time. Use the logs to isolate issues for HDP services that were non-operational for a specific time.
Go to
Control Panel -> All Control Panel Items -> Administrative
            Tools
and click theEvent Viewericon.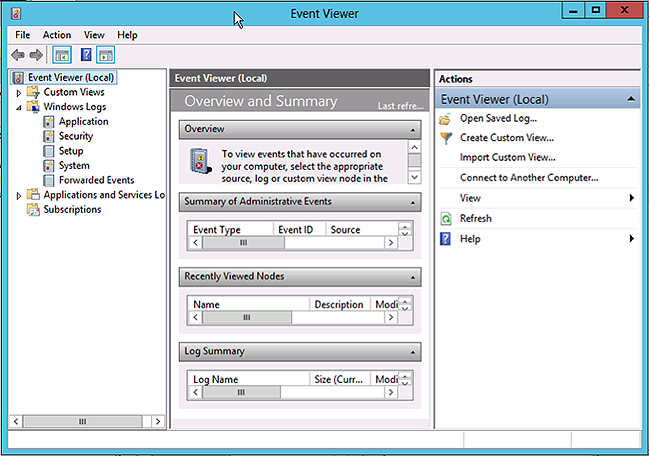
Hardware/system information: Use this information to isolate hardware issues on the affected host machine.
Go to
Control Panel -> All Control Panel Items -> Administrative
            Tools
and click theSystem Informationicon.Network information: Use the following commands to troubleshoot network issues.
ipconfig: This command provides the IP address, checks that the network interfaces are available, and validates whether an IP address is bound to the interfaces. To troubleshoot communication issues among host machines in your cluster, execute the following command on the affected host machine:
ipconfig
You should see output similar to the following:
Windows IP Configuration

Ethernet adapter Ethernet 2:

 Connection-specific DNS Suffix .  :
 Link-local IPv6 Address . . . . . : fe80::d153:501e:5df0:f0b9%14
 IPv4 Address. . . . . . . . . . . : 192.168.56.103
 Subnet Mask . . . . . . . . . . . : 255.255.255.0
 Default Gateway . . . . . . . . . : 192.168.56.100

Ethernet adapter Ethernet:

 Connection-specific DNS Suffix .  : test.tesst.com
 IPv4 Address. . . . . . . . . . . : 10.0.2.15
 Subnet Mask . . . . . . . . . . . : 255.255.255.0
 Default Gateway . . . . . . . . . : 10.0.2.2
netstat -ano: This command generates a list of ports used within the system. To troubleshoot launch issues and resolve potential port conflicts with HDP master processes, run the following command on the host machine:
netstat -ano
You should see output similar to the following:
TCP 0.0.0.0:49154 0.0.0.0:0 LISTENING 752
TCP [::]:49154 [::]:0 LISTENING 752
UDP 0.0.0.0:500 *:* 752
UDP 0.0.0.0:3544 *:* 752
UDP 0.0.0.0:4500 *:* 752
UDP 10.0.2.15:50461 *:* 752
UDP [::]:500 *:* 752
UDP [::]:4500 *:* 752
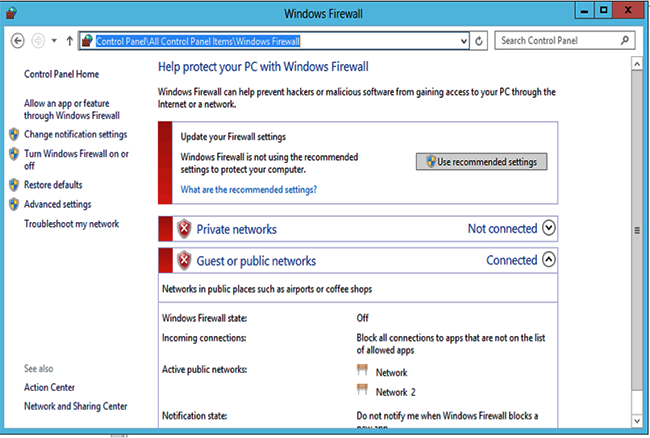
Verify if a firewall is enabled on the host machine: Go to
Control Panel -> All Control Panel Items -> Windows Firewall.You should see the following GUI interface: