You can use the Streaming SQL Console to review the status, properties and log of your
SQL Stream jobs executed in SQL Stream Builder. Using the Flink Dashboard, you can also monitor
the Flink job that is submitted when you execute a SQL query.
Using the Streaming SQL Console🔗
To monitor your jobs with Streaming SQL Console:
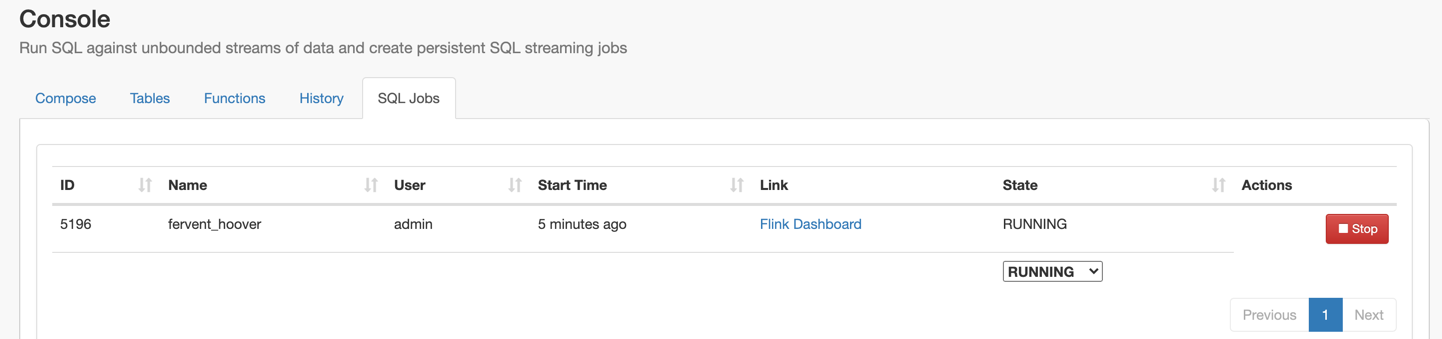
Click Console on the main menu.
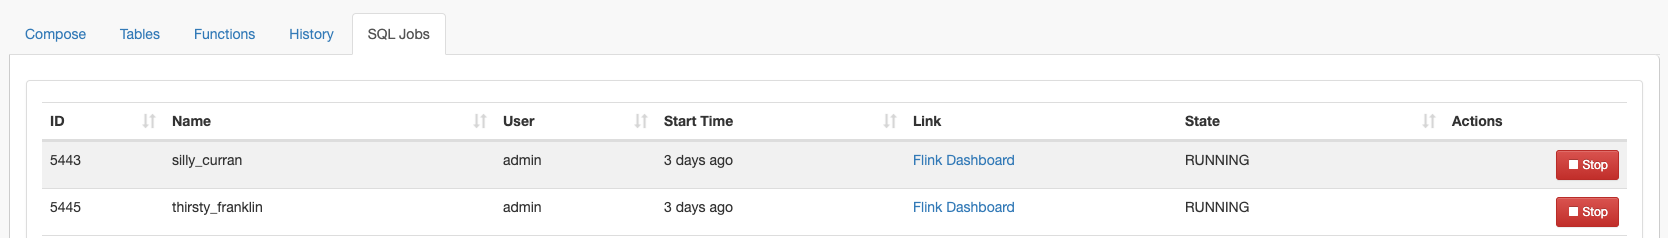
Go to the SQL Jobs tab, and choose a State.
You can choose
from Running, Stopped, Cancelled, and Failed state.
Click on the job you want to monitor.
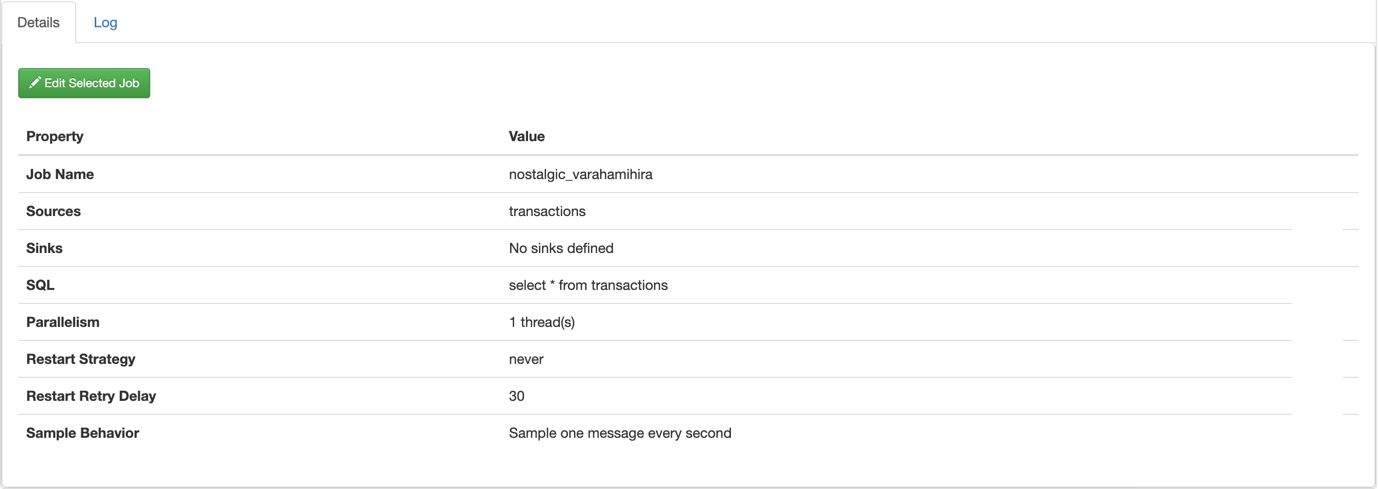
Select Details tab on the bottom panel.
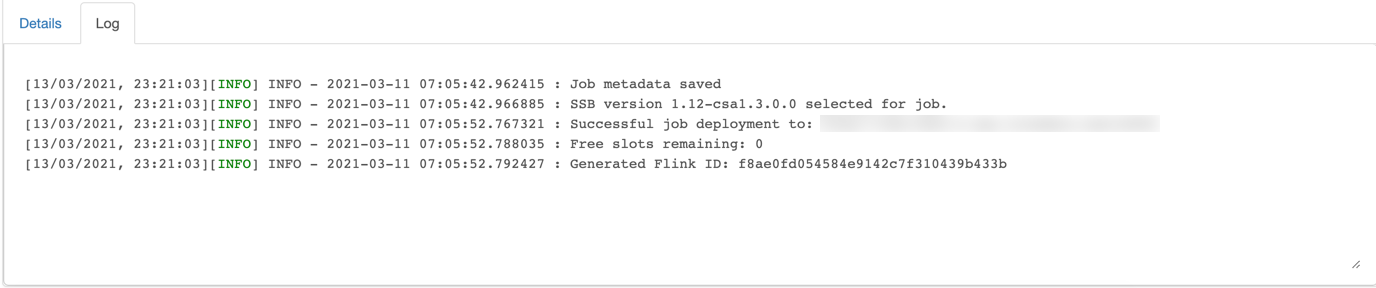
Select Log tab on the bottom panel.
The Logs tab shows detailed logging from the Flink job - any exceptions is logged here.
While the job processes messages, a count of messages processed is spooled to the log every
5
seconds:
8/13/2019, 9:42:49 AM - INFO - 2019-08-08 19:24:17.752157 : 5 Second Count:
        2502
History of SQL jobs🔗
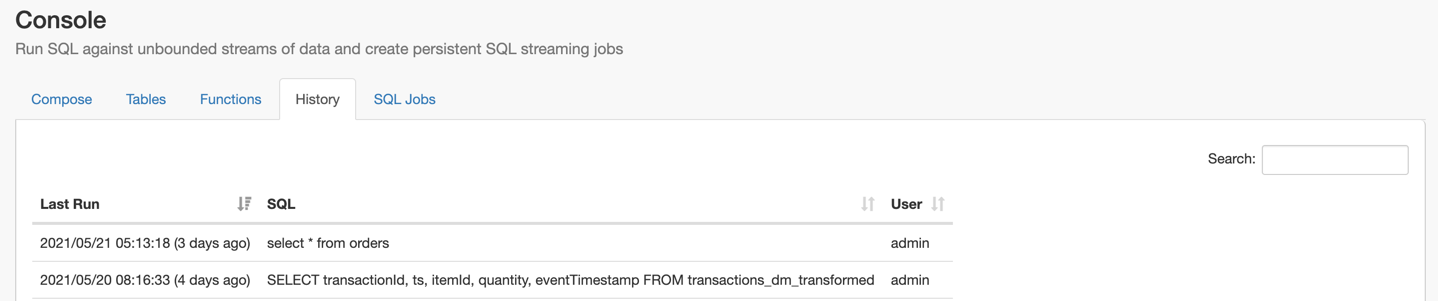
You can review all the SQL jobs that were executed on the History main tab. When you click
on one of the SQL jobs, the SQL query and the job parameters are automatically imported to
the SQL window for execution. You can filter the SQL jobs by the Last time they run or by
the SQL statement that was executed before.
Using the Flink Dashboard🔗
You can also monitor your running SQL jobs using the Flink Dashboard. You can easily reach
the Flink Dashboard on the SQL jobs tab below the Console main menu. After clicking on the
Flink Dashboard, you are redirected to the Flink Dashboard interface.
We want your opinion
How can we improve this page?
What kind of feedback do you have?
This site uses cookies and related technologies, as described in our privacy policy, for purposes that may include site operation, analytics, enhanced user experience, or advertising. You may choose to consent to our use of these technologies, or