The following steps use Cloudera Manager's Chart Builder to track disk usage on the
Application Block Device (mounted to /var/lib/cdsw on the CDSW master host)
over time.
-
Log into the Cloudera Manager Admin Console.
-
Click .
-
Enter a
tsquery
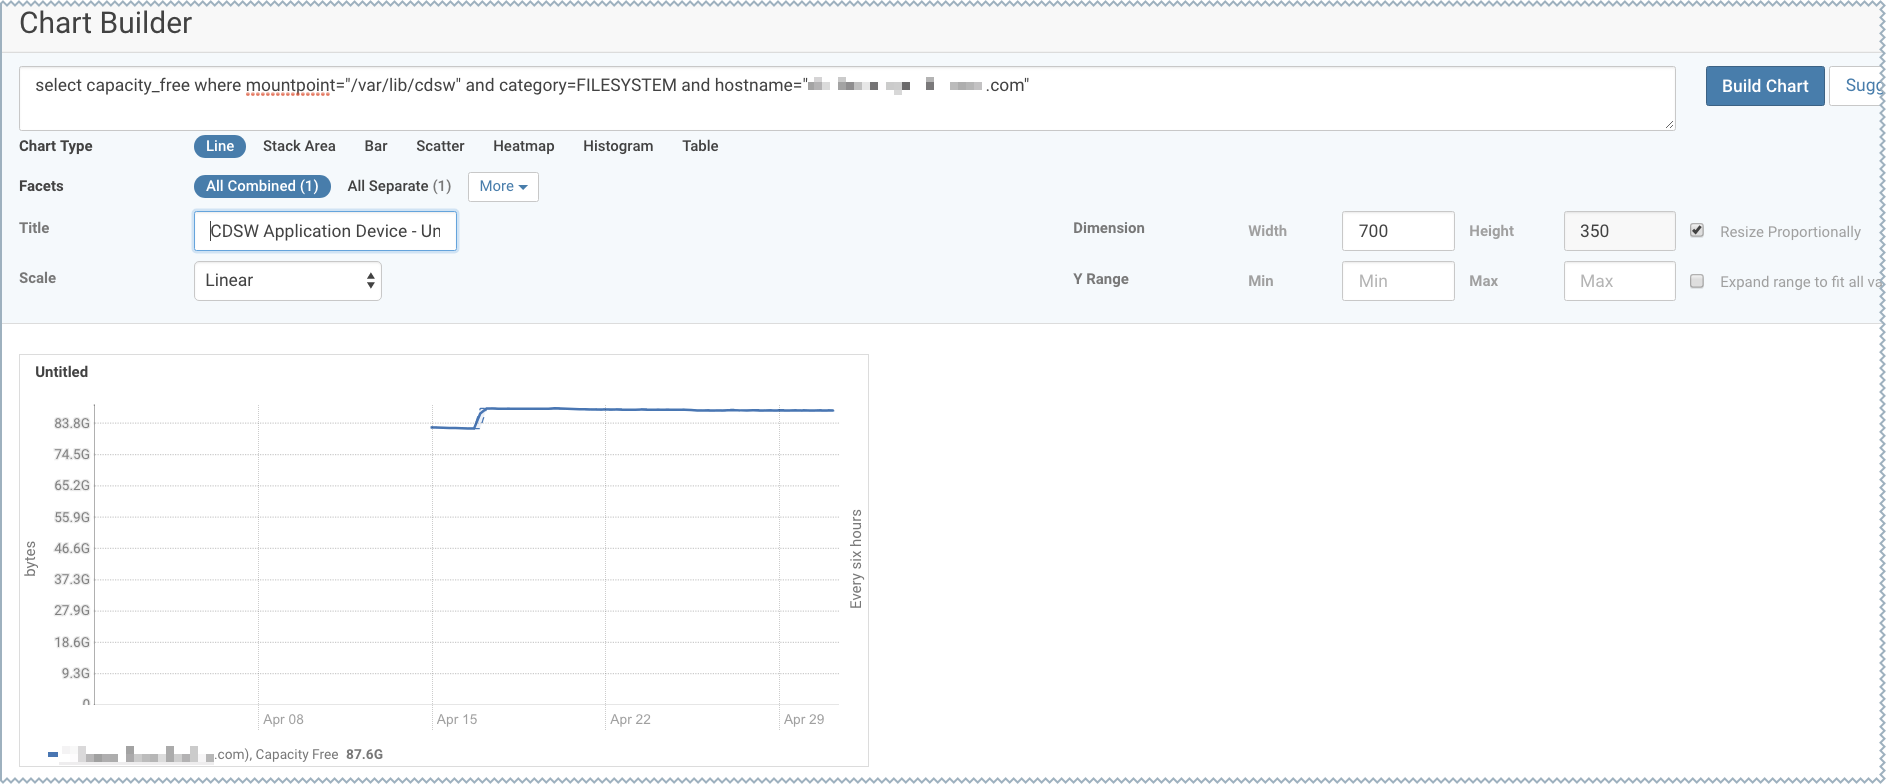
that charts disk usage on the block device. For example, the following tsquery
creates a chart to track unallocated disk space on the Application block device.
select capacity_free where mountpoint="/var/lib/cdsw" and category=FILESYSTEM and hostname="<CDSW_Master_hostname>"
Alternatively, you could use the following tsquery to track the disk space already in
use on the block device.
select capacity, capacity_used where mountpoint="/var/lib/cdsw" and category=FILESYSTEM and hostname="<CDSW_Master_hostname>"
Make sure you insert the hostname for your master host as indicated in the
queries.
-
Click Build Chart. You should see a preview of the chart
below.
-
Click Save.
-
Enter a name for the chart.
-
Select Add chart to another dashboard. From the dropdown list of
available System Dashboards, select CDH Cloudera Data Science Workbench Status
Page.
-
Click Save Chart. If you navigate back to the CDSW service page,
you should now see the new chart on this page.
For more details about Cloudera Manager's Chart Builder, see the following topic in
the Cloudera Manager documentation:
Charting Time Series Data.