You can use the Streaming SQL Console to review the status, properties and log of your
SQL Stream jobs executed in SQL Stream Builder. Using the Flink Dashboard, you can also monitor
the Flink job that is submitted when you execute a SQL query.
Using the Streaming SQL Console🔗
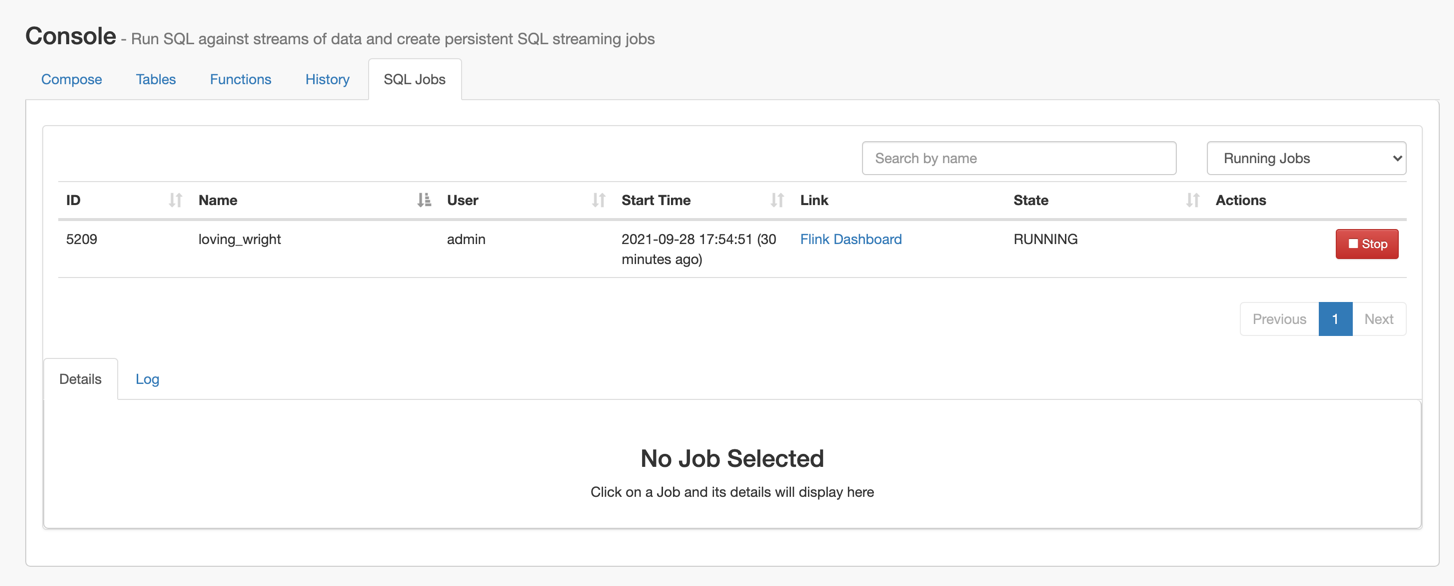
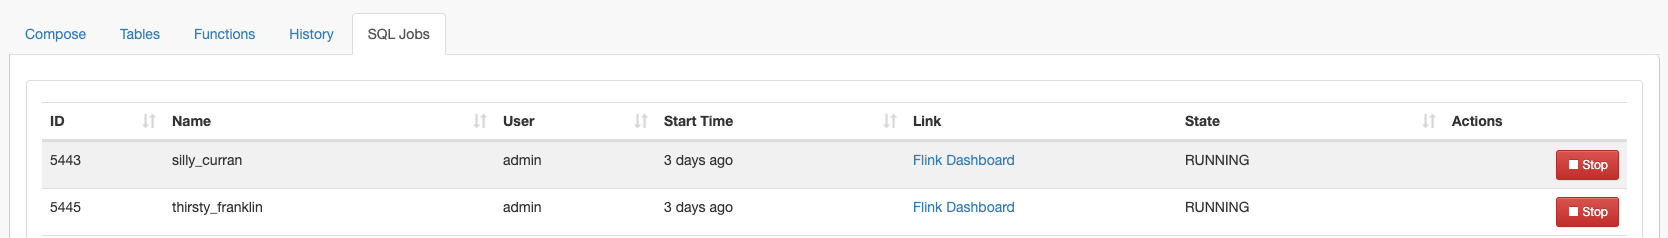
When using the SQL Jobs page in Streaming SQL Console to monitor your
SQL jobs, you can review the ID, the Name, the Start time, the State of the submitted jobs,
and the User who submitted the SQL jobs. When monitoring running jobs, you are also able to
open the Flink Dashboard, and stop the job using the
Stop button under Actions. The Flink
Dashboard link and Stop button are not available for
Stopped Jobs.
Click Console on the main menu.
Select SQL Jobs tab.
By default, Running Jobs are displayed
on the SQL Jobs page.
Select Running Jobs or Stopped Jobs from
the drop-down menu.
Click on the job you want to monitor.
You can further filter down the results, by directly searching for the job name in
the Search field.
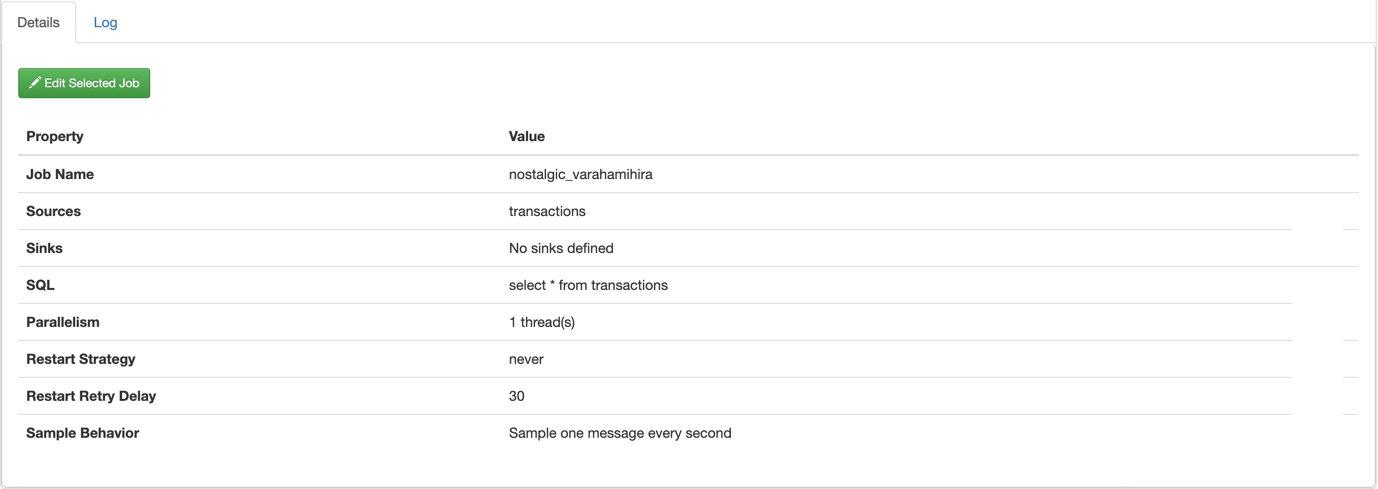
Select Details tab on the bottom panel to display additional
details and configurations about the SQL job.
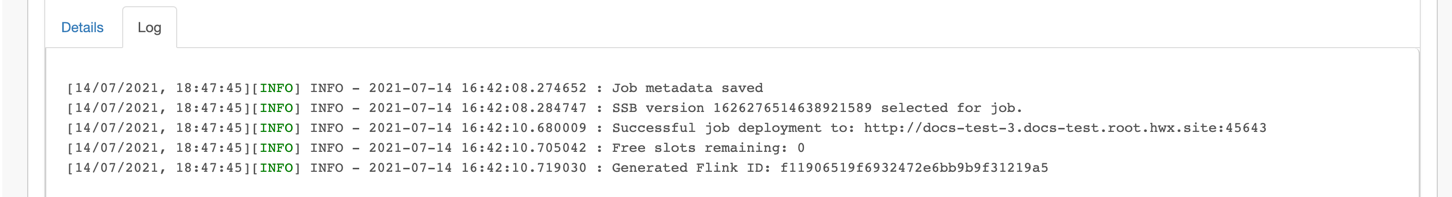
Select Log tab on the bottom panel to review the log
information of the job submission.
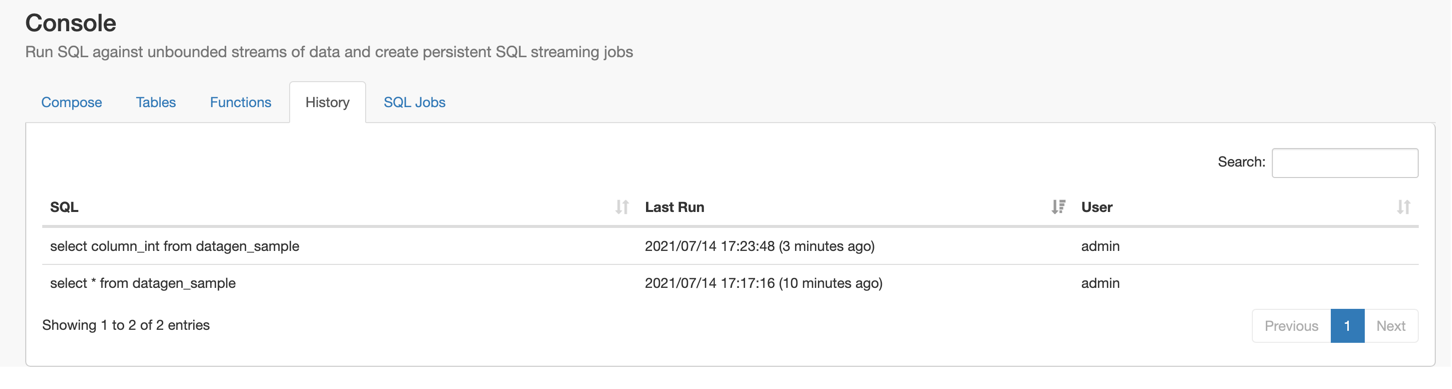
History of SQL queries🔗
You can review and reuse the SQL queries that were previosuly executed on the
History page. When you click on one of the SQL queries, it is
automatically imported to the SQL window for execution. You can filter the SQL queries by
the time they were last run or by the user who run them. You can also search for a type of
SQL query using the Search field.
Using the Flink Dashboard🔗
You can also monitor your running SQL jobs using the Flink Dashboard. You can easily reach
the Flink Dashboard on the SQL jobs tab below the Console main menu. After clicking on the
Flink Dashboard, you are redirected to the Flink Dashboard interface.
We want your opinion
How can we improve this page?
What kind of feedback do you have?
This site uses cookies and related technologies, as described in our privacy policy, for purposes that may include site operation, analytics, enhanced user experience, or advertising. You may choose to consent to our use of these technologies, or