Inspecting Network Performance
The Network Performance Inspector allows you to examine the latency among the hosts managed by Cloudera Manager. You can use this tool to diagnose latency issues that can significantly affect the performance of workloads such as MapReduce jobs, Spark jobs, and Hive and Impala queries, particularly when using remote storage.
The inspector runs ping commands from each host to all other hosts, and reports the average ping time and packet loss percentage. You can use this information to identify problematic hosts or networking infrastructure issues so that you take corrective action. You can run the inspector on-demand, and it also available when adding a new cluster. You can also run the inspector using the Cloudera Manager API.
Running the Network Performance Inspector From the Cloudera Manager Admin Console
- Open the Network Performance Inspector from one of the following pages in the Cloudera Manager Admin Console:
- From the All Hosts page:
- Select .
- Click the Inspect Network Performance button to launch the inspector.
- From the Cluster Status page:
- Select
- In the Status section, click the Hosts link at the top of the list of Cluster Services to open the Hosts page.
- Click the Inspect Cluster Network Performance button to launch the inspector.
The Inspect Network Performance dialog box opens.
- From the All Hosts page:
- Enter the following information:
- Source Cluster – Select a cluster to inspect from the drop-down list.
Select Run against another cluster to select additional clusters. An additional drop-down list displays from which you can select an additional cluster to inspect.
- Ping Timeout – Amount of time, in seconds, after which the inspector reports a failure.
- Ping Count – Number of times the inspector pings each host.
- Ping Packet Size – Size, in bytes, of the test packet sent when pinging the hosts.
- Source Cluster – Select a cluster to inspect from the drop-down list.
- Click Run.
The Cluster Performance Inspector command window opens. When the Inspector finishes, click the Show Inspector Results button to open the Network Performance Inspector Results page.
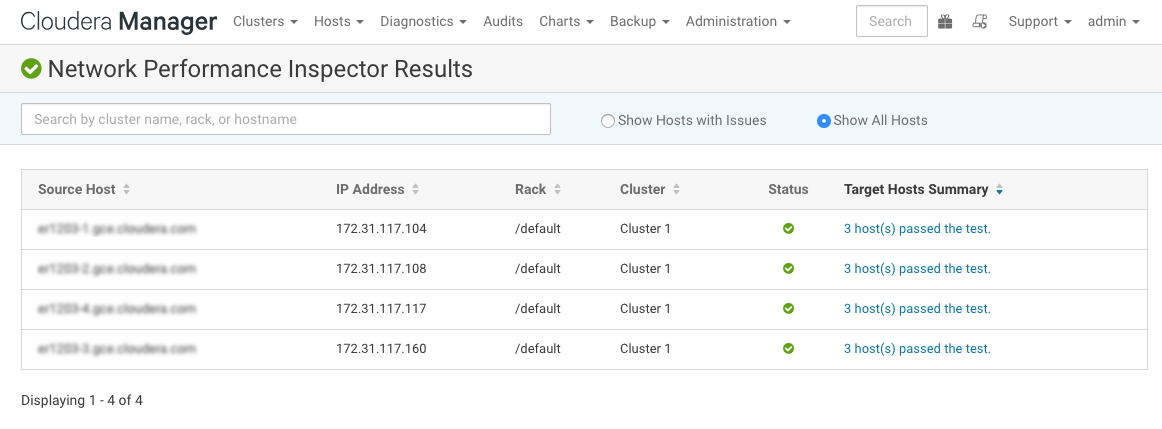
Select Show Hosts with Issues to display any problems found by the inspector, or select Show All Hosts. The Network Diagnostic Result page displays a table of results. Each row represents a single host. The Target Hosts Summary column summarizes the performance of the host. Click the summary text to view detailed performance statistics from this host to each of the other hosts.

The inspector summarizes the status of the hosts using three icons:- Green – Good network performance.
- Orange – Concerning network performance. Any host with a ping latency in the range of 1 to 4 milliseconds.
- Red – Bad network performance. Any target host that is unreachable by hostname (has a 100% packet loss), any host with a ping latency greater than 4 milliseconds, or any target host with a packet loss of 1% or greater.
Poor performance can result from firewall settings, router configurations, network topology, and other factors. You may need to work with your network administrator to mitigate these issues.
Running the Network Performance Inspector From the Cloudera Manager API
- /cm/commmands/hostsPerfInspector
Invokes the inspector across an arbitrary set of hosts, (including hosts that are not part of the cluster).
- /cm/commands/clusterPerfInspector
Invokes the inspector across the hosts in two clusters.
- /clusters/cluster Name/commands/perfInspector
Invokes the inspector across the hosts of a specified cluster.
For more information, see the Cloudera Manager REST API documentation
Inspecting Network Bandwidth Using the Cloudera Manager API (Quick Test)
You can use the Cloudera Manager API to run a quick check of available network bandwidth between clusters managed by a single instance of Cloudera Manager. This API tests the bandwidth between as many hosts as possible within two minutes. The test does not provide a complete view of the bandwidth used by all hosts.
This test is only available using the Cloudera Manager API. For more information see POST /cm/commands/clustersPerfInspector. You can run the test programmatically and then query the command ID returned by the command to obtain the bandwidth data.
Alternately, you can use the Cloudera Manager API Explorer (Swagger) to run the test and the Cloudera Manager Command Details page to download the JSON containing the bandwidth data. See Running the Quick Bandwidth Test Using the Cloudera Manager API Explorer (Swagger), below.
Before running the Bandwidth Inspector, you may need to install the iperf utility. See the Requirements section below for details.
Requirements
To use this API, you must ensure that the iperf utility is installed on all cluster hosts. Run the appropriate commands from the list below for your operating system. You must run the commands on all hosts and run them as the root user.
- Ubuntu/Debian:
Run the following command on all cluster hosts:
apt-get install iperf3
- SLES 12:
- Add the SLES 12 repository that contains iperf package. Note that the iperf3 package is named iperf on SLES 12.
See https://software.opensuse.org/download.html?project=network%3Autilities&package=iperf.
- Run the following command on all cluster hosts:
zypper addrepo https://download.opensuse.org/repositories/network:utilities/SLE_12_SP3/network:utilities.repo
zypper refresh
zypper install iperf
- Add the SLES 12 repository that contains iperf package. Note that the iperf3 package is named iperf on SLES 12.
- RHEL 6.8/6.9/6.10
For RHEL 6.8, 6.9, or 6.10, the iperf3 package is part of the EPEL repository.
- Enable the EPEL repository for RHEL 6:
- Run the following command on all cluster hosts:
yum install https://dl.fedoraproject.org/pub/epel/epel-release-latest-6.noarch.rpm
yum install iperf3
- RHEL 7.2/7.3
The iperf3 package is not available in the base repository nor the EPEL repository.
- Install iperf-3.1.3 from the official iperf website: https://iperf.fr/iperf-download.php#fedora
- Run the following command on all cluster hosts:
yum install https://iperf.fr/download/fedora/iperf3-3.1.3-1.fc24.x86_64.rpm
- RHEL 7.4 or higher
For RHEL 7.4 and higher, the iperf3 package is part of the base repository.
Run the following command on all cluster hosts:yum install iperf3
Running the Quick Bandwidth Test Using the Cloudera Manager API Explorer (Swagger)
- Log in to the Cloudera Manager Admin Console as a user with the Full Administrator role.
- Click .
The Swagger interface displays.
- Click ClouderaManagerResource.
- Click POST /cm/commands/clustersPerfInspector.
The interface for the PerfInspector command displays.
- In the Parameters section, copy the following JSON code into the body text box.
{
"sourceCluster": "<SourceClusterName>",
"targetCluster": "<TargertClusterName>",
"pingArgs": {
"pingTimeoutSecs": 10,
"pingCount": 10,
"pingPacketSizeBytes": 56
},
"bandwidthArgs": {
"runBandwidthDiagnostics": true,
"bandwidthTimeoutSecs": 10
},
"policyType": "QUICK"
}
- Replace the <SourceClusterName> and <TargertClusterName> arguments with the names of the clusters you want to inspect.
- Optionally, set the values of the pingArgs arguments as needed.
- Optionally, set the value of the bandwidthTimeoutSecs argument. A lower value will allow the inspector to inspect more hosts within the two minute limit, but will return less accurate results.
- Click the Try it out! button.
- In the Cloudera Manager Admin Console, click the Running Commands Icon (
 ) in the
upper-right of the screen.
) in the
upper-right of the screen.
If the command is still running, click the Clusters Performance Inspector link. If the command has finished, click the All Recent Commands link and then click the Clusters Performance Inspector link.
The Clusters Performance Inspector Command page displays.
- Click the second group labeled Execute <N> steps in parallel.
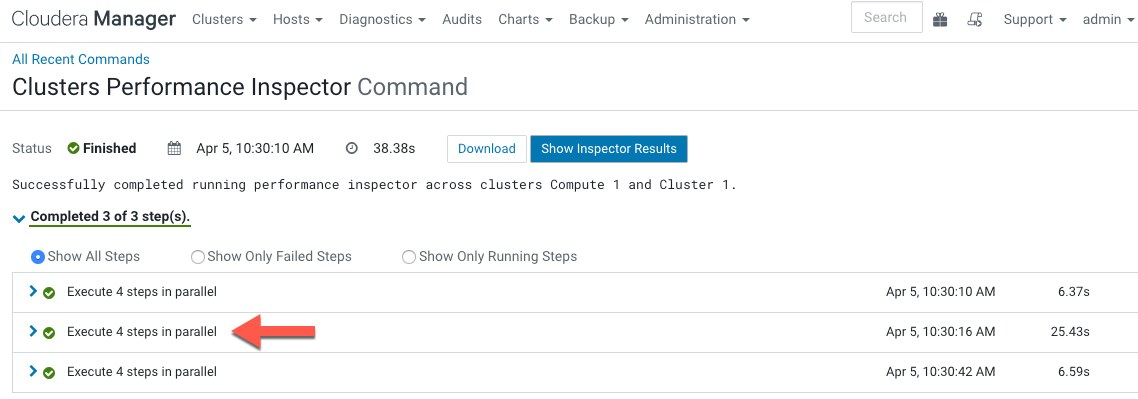
A grouping displays for each host in the source cluster.
- To view bandwidth data for each host in the source cluster:
- Click the Open in New Tab icon (
 ) located to the left of the host URL.
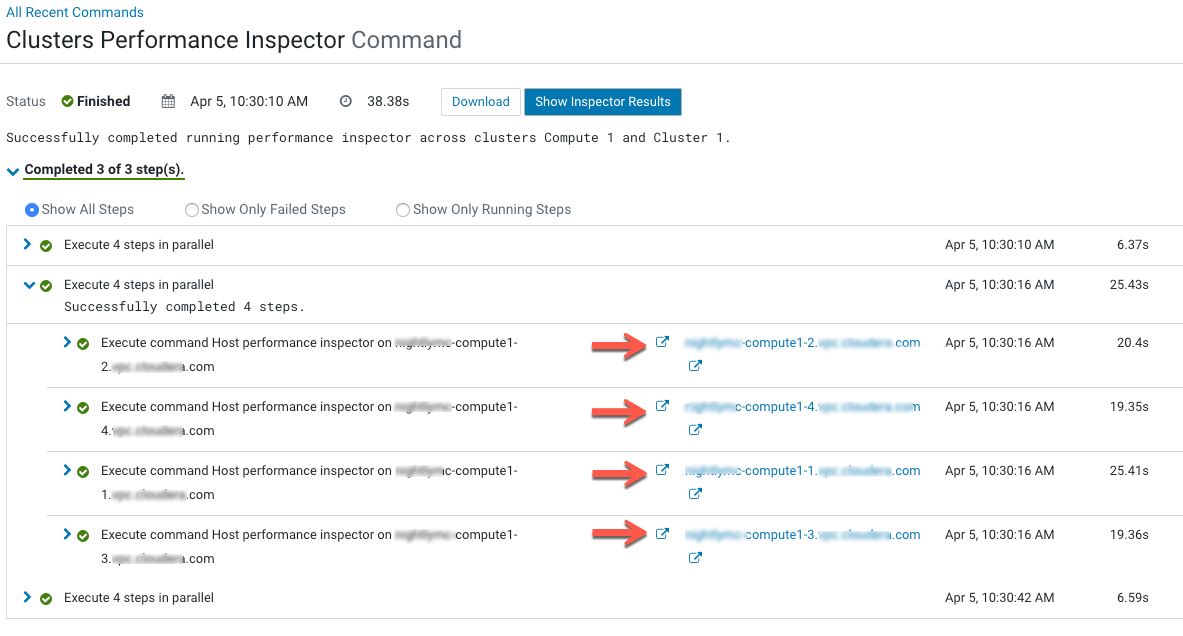
The command details page for the host opens.
- Click the Download button.
A JSON file with the bandwidth results for the host in the target cluster displays. For example:
{
    "targetHostsNetStats": [
        {
            "avgLatencyMillisecs": 0.408,
            "bwSentBitsPerSecond": 1035665000.0,
            "packetLossPercent": 0.0,
            "success": true,
            "maxLatencyMillisecs": 0.611,
            "hostName": "sales-storage-4.prod.myco.com",
            "minLatencyMillisecs": 0.299,
            "bwReceivedBitsPerSecond": 1033526000.0,
            "mdevLatencyMillisecs": 0.082
        }
    ]
}
In this JSON file:- hostName is the host in the target cluster that was tested.
- bwSentBitsPerSecond is the results of the send bandwidth test.
- bwReceivedBitsPerSecond is the results of the receive bandwidth test.
- Repeat the above steps to view bandwidth data for each source host.
- Click the Open in New Tab icon (
