Cloudera Navigator Business Metadata
Cloudera Navigator lets organizations catalog data contained in Hadoop clusters. With data entities in the cluster tagged with relevant metadata properties, data stewards can provide curated datasets, business users can do their own self-service discovery, and system administrators can develop effective archival strategies.
The Navigator Metadata Server is the role instance that provides the metadata definition, tagging, and management system. Any given entity can be identified by one or more of the three different classes of metadata.
Cloudera Navigator console lets you view metadata through various dashboards, such as the Data Stewardship Dashboard and Data Explorer, that provide at-a-glance views of cluster assets.
This section focuses on the HDFS Analytics menu of the Cloudera Navigator console.
Three Different Classes of Metadata
Cloudera Navigator supports extraction of three different types of metadata from the data contained in the cluster. The characteristics of each type are summarized in the table.
| Category | Description | Usage Note |
|---|---|---|
| Technical Metadata | Characteristics inherent to the entity that are obtained when extracted. | Not modifiable. |
| Managed Properties | Key-value pairs that can be defined once and applied globally to specific entity types. Properties are defined within namespaces, and values can be constrained by type (such as Text, Number, Boolean, Date, Enumeration). | |
| User-defined Properties | Tags and key-value pairs that can be added to entities before or after extraction. When users create these properties, they are one-off instances of metadata for an entity. If your organization finds these properties useful, consider defining a managed property instead and take advantage of the structure provided by that metadata type. | Recommended that you use managed properties. |
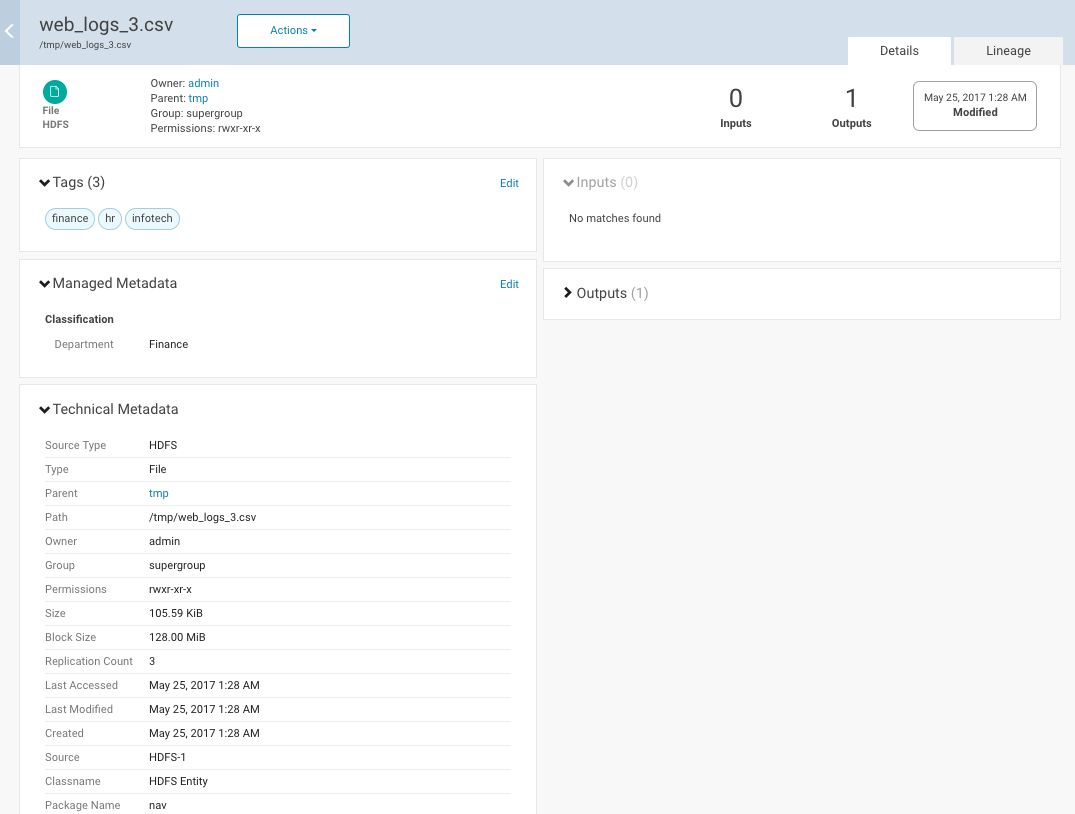
- The technical metadata was extracted from the source system, in this example, HDFS.
- The managed properties were defined by a data steward from the Finance department to augment entities processed by the system with properties that enable self-service data discovery for cluster data. That is, business users looking for data handled by the Finance department can more easily locate files that have been labeled with these properties.
- Tags have also been applied to this file.
Technical metadata is obtained from the source entity and cannot be modified. Common examples of technical metadata include an entity's name, type (directory or file, for example), path, creation date and time, and access permissions. For entities created or managed by cluster services, technical metadata may include the name of the service that manages or uses that entity and relations—parent-child, data flow, and instance of—between entities.
For example, for Hive entities, Cloudera Navigator extracts the extended attributes added by Hive clients to the entity. As another example, technical metadata for an Amazon S3 bucket includes Bucket name, Region (AWS Region, such as us-west-1), S3 Encryption, S3 Storage Class, S3 Etag, Source (S3), and so on. Technical metadata is simply whatever metadata is provided for the entity by the system that created the entity.
Continue reading:
Viewing Metadata Analytics
Required Role: Metadata & Lineage Viewer and Policy Editor (or Full Administrator)
- Open your browser.
- Navigate to the host within the cluster running the Navigator Metadata Server role as shown in this example (7187 is the default port for Navigator Metadata Server):
http://fqdn-1.example.com:7187/login.html
The login page displays. - Log in to the Cloudera Navigator console using the credentials assigned by your administrator.
- Go to . The HDFS Analytics tab displays.
- The HDFS Analytics page displays a set of bar graphs that list the number of files that satisfy groups of values for last access time, created time, size, block size, and replication
count.
- To display the files at the right, click a bar. This draws a blue selection outline around the bar and selects the property checkbox.
- To select more than one value, grab a bar edge and brush a range of values.
- To change a range, click a bar, drag to a different range of values, and then drop.
- To reduce a range, grab a bar edge and contract the range.
- To clear a property, clear the checkbox. The previous selection is indicated with a gray outline.
- When you select a previously selected property, the previous selection is reused. For example, if you had previously selected one and three for replication count, and you reselect the replication count checkbox, the values one and three are reselected.
- To clear all current and past selections, click Clear all selections.
- In the listing on the right, select an option to display the number of files by directory, owner, or tag. In the listing:
- Filter the selections by typing strings in the search box and pressing Enter or Return.
- Add categories (directory, owner, or tag) to a search query and display the Search tab by doing one of the following:
- Clicking a directory, owner, or tag name link.
- Selecting . To further refine the query, select one or more checkboxes, and select .
-
Required Role: Policy Editor (or Full Administrator)
Add categories to the search query of a new policy and display the Policies tab by selecting . To further refine the query, select one or more checkboxes, and select .
