Getting started with Kafka
Get started with Kafka in Cloudera Streaming Community Edition.
- How to create a topic using Streams Messaging Manager.
- How to produce and consume data using Kafka's built-in console clients as well as your own client applications.
- How to monitor topic activity in Streams Messaging Manager.
Before you begin
docker ps. For
example:docker ps -a --format '{{.ID}}\t{{.Names}}' --filter "name=kafka.(\d)" The Kafka container will either be called csce-kafka-1 or
csce_kafka_1.
Creating a topic
Learn how to create a Kafka topic using the Streams Messaging Manager UI.
- Click
 (Topics) in the navigation sidebar.
Producing and consuming data
Learn how to produce and consume data to and from Kafka topics using Kafka’s built-in console tools or your own client application.
Once you have created your topic it's time to start producing (writing) and consuming (reading) some data (also referred to as records or messages). Data production and consumption happens using Kafka producer and consumer applications, or clients for short. Clients connect to a Kafka server, called a broker, and either produce data to or consume data from topics. In most production environments these applications are custom built using a Kafka client library. However, Kafka is shipped with command line tools, including a console producer and consumer application that you can use to test Kafka’s features and capabilities.
The following list of steps will walk you through how you can use Kafka’s built-in console producer to produce some messages and then consume and view those messages using the Streams Messaging Manager UI. Additionally, information about how to configure your own custom developed clients to connect to Kafka in Cloudera Streaming Community Edition is also provided.
- Ensure that you have a topic available. If not, create one, see Creating a topic.
- Ensure that you have the Streams Messaging Manager UI open. If not, enter the
following in a browser window:
http://localhost:9991
- Open a terminal sessions and run the following
command:
docker exec -it [***KAFKA CONTAINER NAME OR ID***] /bin/bashThis command launches a Bash session within the docker container that Kafka is running in. The interactive session is required to run the console producer.
- Run the console producer to start producing
data.
The/opt/kafka/bin/kafka-console-producer.sh --bootstrap-server localhost:9094 --topic csce--bootstrap-serveroption specifies the host and port of the Kafka broker that the client should connect to. The--topicoption specifies the topic that data will be produced to. - Start typing to produce
data.
>my first message
>my second message
Once you are done entering messages, ensure that you leave the console producer running.
- In the Streams Messaging Manager UI locate your topic and click
 (Profile) next to the topic name.
 - Go to Data Explorer.
The Data Explorer tab lets you sample the data that is flowing through the topic. The messages that you produced using the console producer will be available on this page. Select different partitions and experiment with the slider controls to view data.
- Switch over to the terminal session running the producer and produce some more data.
- Switch back to the Data Explorer in Streams Messaging Manager and refresh the page.
The new messages you produced should be visible in Data Explorer.
- Close the producer session with CTRL+C.
bootstrap.servers=localhost:9094- In the Streams Messaging Manager UI locate your topic and click (Profile) next to the topic name.
- Go to Data Explorer.
The Data Explorer tab lets you sample the data that is flowing through the topic. The messages that you produce will be available on this page. Select different partitions and experiment with the slider controls to view data.
Monitoring Kafka topics with Streams Messaging Manager
Learn how you can monitor Kafka topics and topic activity in Streams Messaging Manager.
Now that you know how to create a topic and produce/consume data, it is time to learn how you can monitor your topics and the activity of those topics using Streams Messaging Manager.
Although you already have a topic with some data, the following steps will walk you through another production/consumption process where data production and consumption is continuous. This is done so that the topic activity is closer to what you would actually see in a production environment. Once you have the data flowing, you will access the Streams Messaging Manager UI and monitor topic and client activity as well as look at the data that is being produced.
- Ensure that you have a topic available. If not, create one, see Creating a topic.
- Ensure that you have the Streams Messaging Manager UI open. If not, enter the
following in a browser window:
http://localhost:9991 - Ensure that you have two interactive Bash sessions open in the Kafka container. If not,
open two separate terminal sessions and run the following command in both
sessions:
docker exec -it [***KAFKA CONTAINER NAME OR ID***] /bin/bash
-
Switch over to the Streams Messaging Manager UI and start monitoring topic
activity.
When you open Streams Messaging Manager, you are presented with the Overview page. This page gives you information about the total number of producers, brokers, topics, and consumer groups. It also provides more detailed metrics about producers and consumers. The following points give a quick introduction of the UI and its features. Feel free to experiment and explore.
- In the middle you have a list of topics. Here, you can identify and review some key
metrics for the overall topic activity. Clicking on a topic lists the partitions of
that topic as well as partition-level metrics.
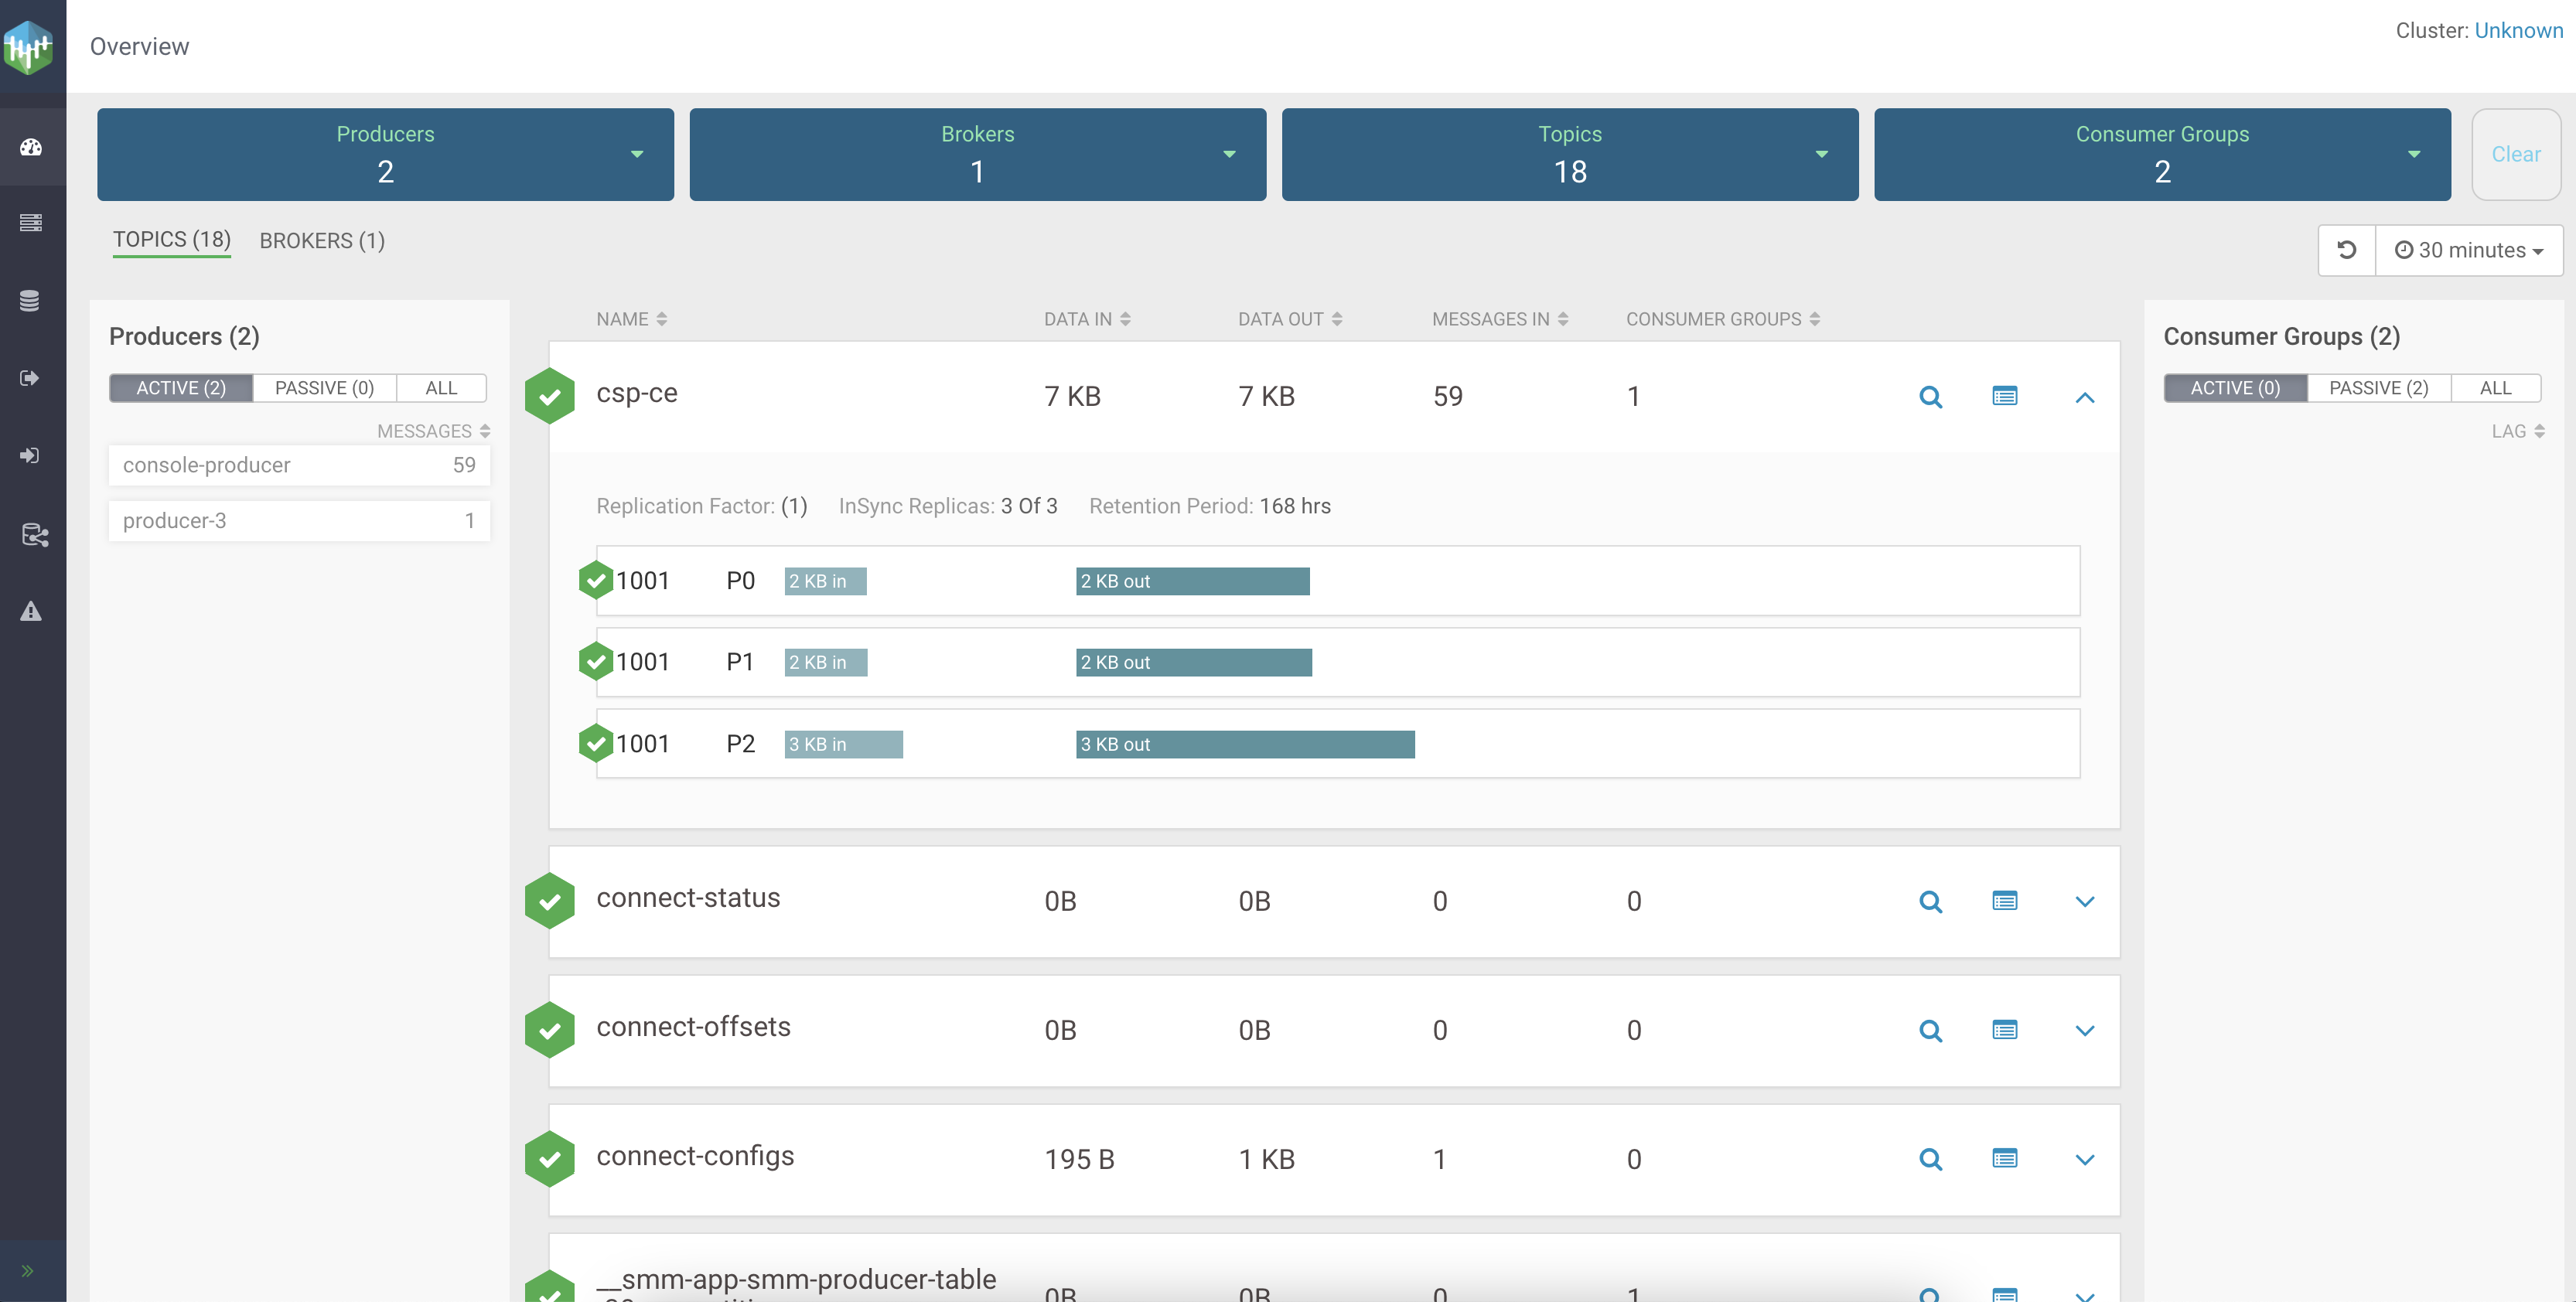
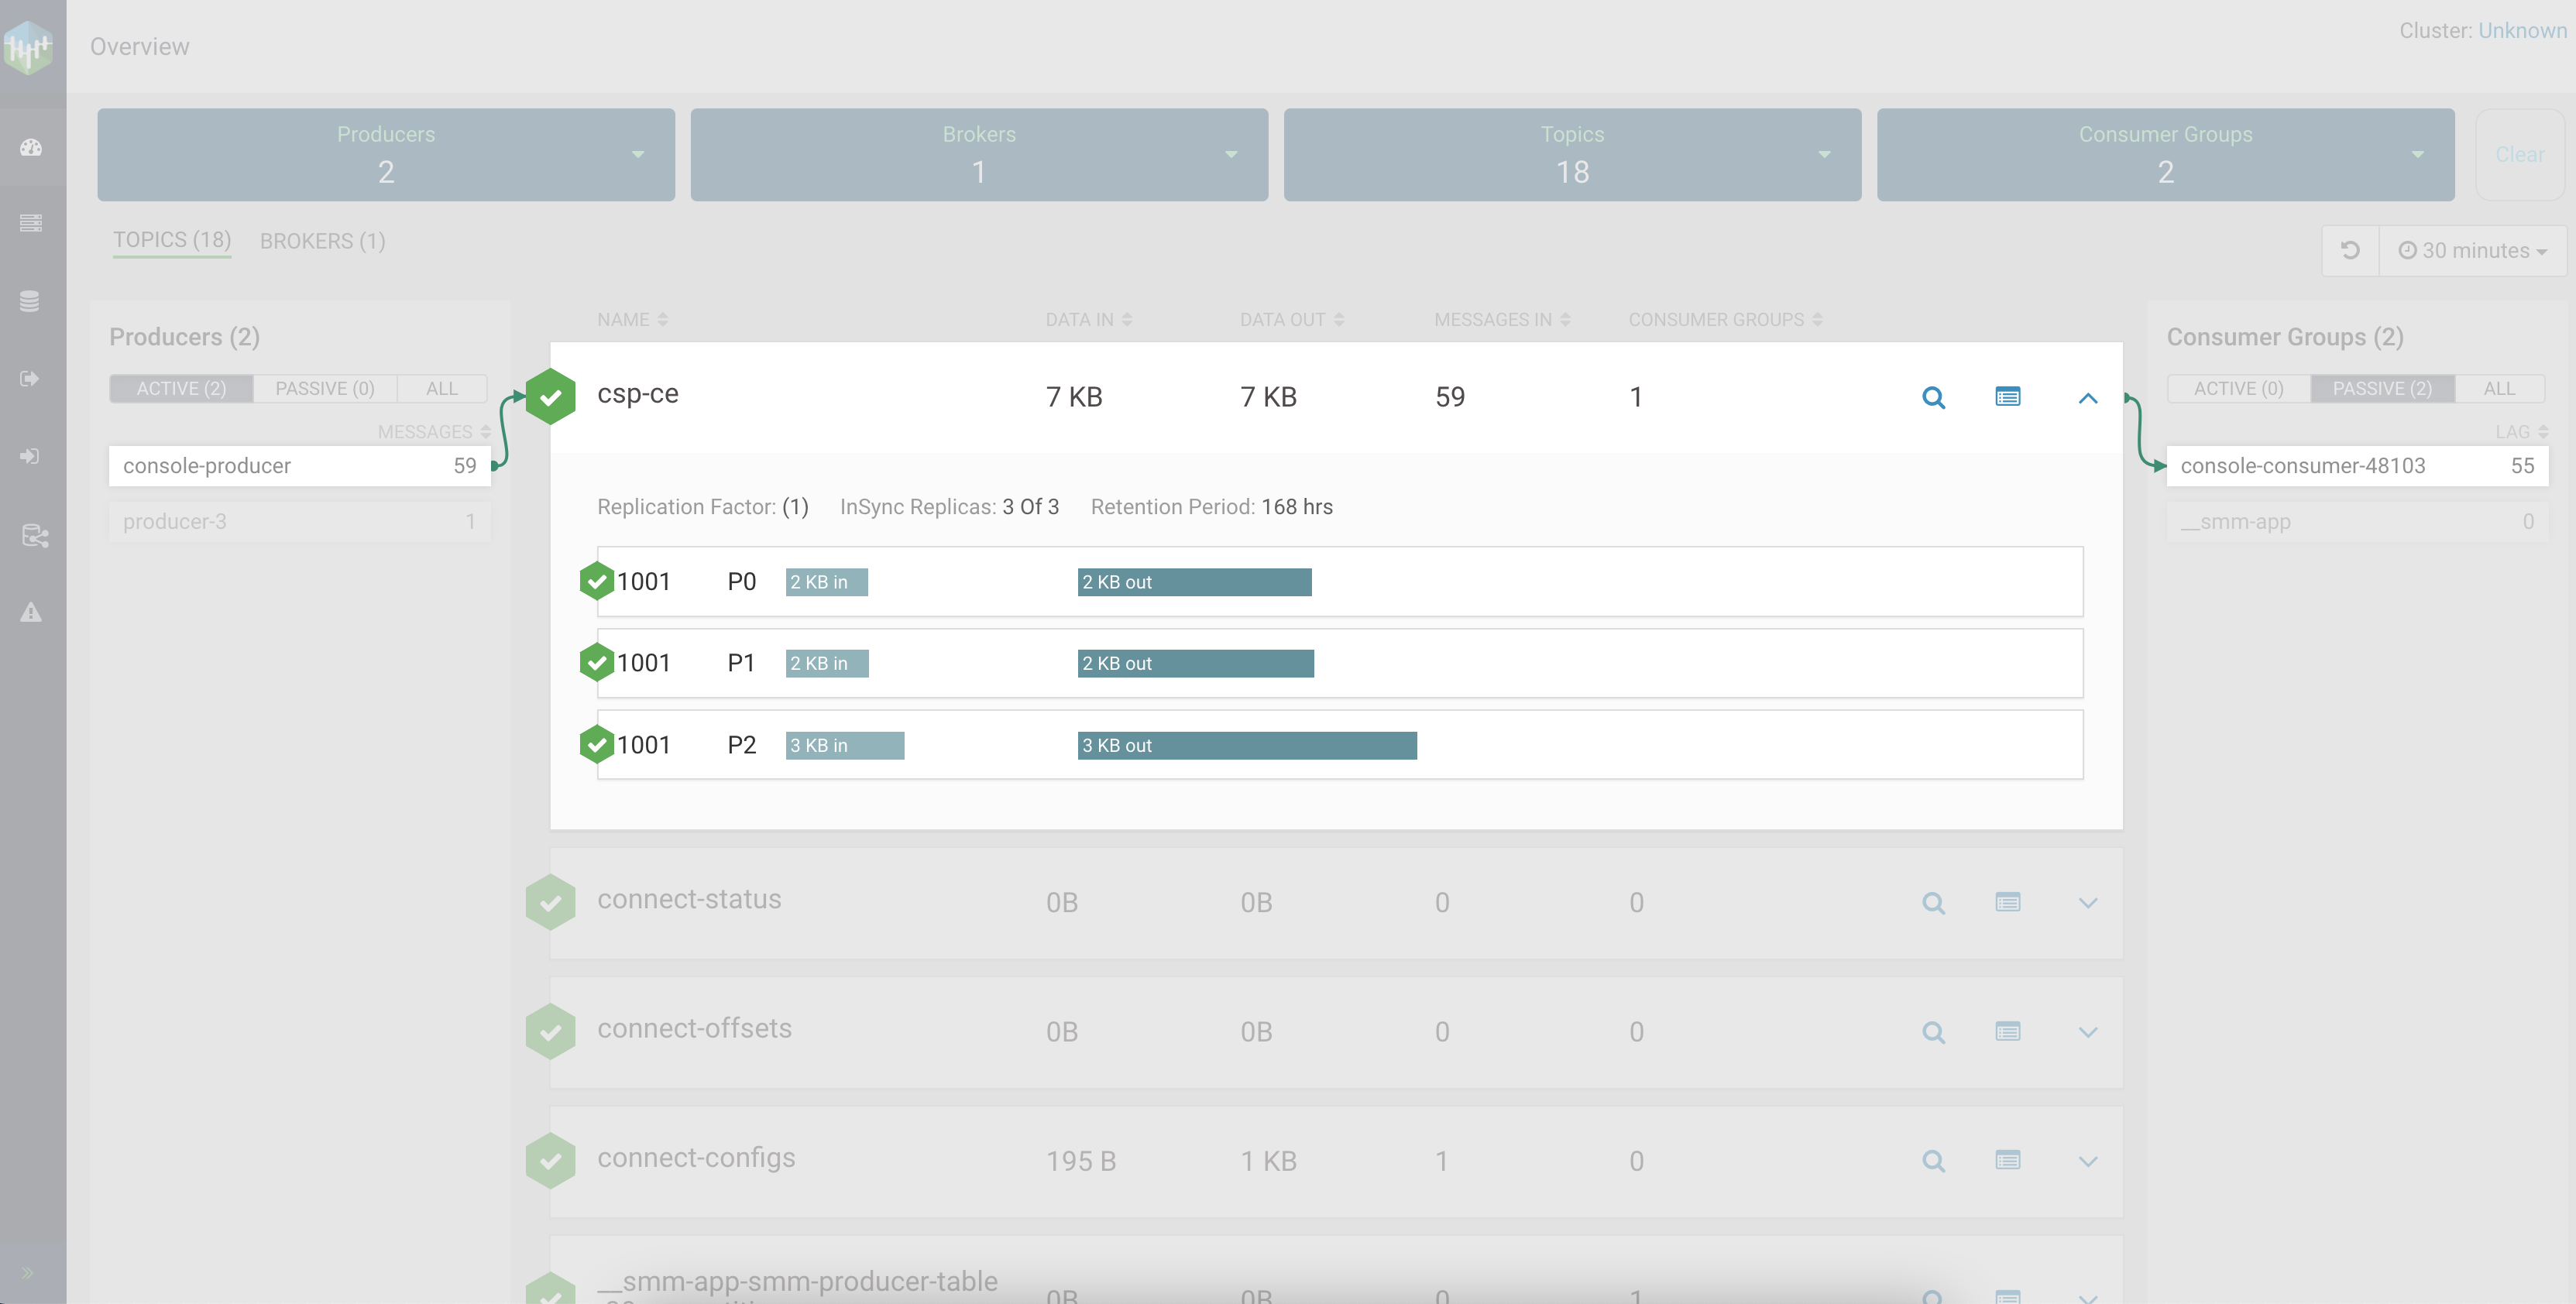
- On the left and right hand side of the page you can see your producers and
consumers. If everything is working correctly, you should see at least one active
producer and at least one active consumer. Clicking on either the producer or consumer
will show their activity, highlighting all the topics and partitions they are writing
to or reading from, respectively.
- Clicking on (Profile) redirects you to the topic
details page which has a total of four tabs. The tabs and the information they present
are as follows:
The Metrics tab collects all the topic-related metrics and utilization charts.The Data Explorer tab lets you sample the data that is flowing through the topic. Select different partitions and experiment with the slider controls to view data. If the topic you are viewing is getting data produced into it actively, you can refresh the page to see the latest messages being producedThe Configs tab gives you an overview of the topic’s configuration properties. Additionally, you can also reconfigure a topic on this tab.
The Latency tab gives you a powerful snapshot of end-to-end latency including the number of consumer groups for a topic, number of clients inside a particular consumer group, and number of partitions in a topic. This tab also includes two graphs that visualize messages consumed as well as end-to-end latency. By default the Latency tab will not show any data. This is because in order for Streams Messaging Manager to fetch metrics related to end-to-end latency, clients must be configured. Specifically, interceptors must be enabled within the client. This is not covered in this tutorial. For more information on enabling interceptors and monitoring end-to-end latency, see Monitoring End-to-End Latency using Streams Messaging Manager.
- In the middle you have a list of topics. Here, you can identify and review some key
metrics for the overall topic activity. Clicking on a topic lists the partitions of
that topic as well as partition-level metrics.
Completing this tutorial you learned how to create Kafka topics using Streams Messaging Manager, how to produce and consume data and got familiar with the basic monitoring features of Streams Messaging Manager. Cloudera recommends that you hop over to the Schema Registry or Kafka Connect tutorials and complete those as well. Alternatively, If you want to dive deeper into Kafka or Streams Messaging Manager, visit any of the resources listed in the Related Information section below.