You can use the Streaming SQL Console to review the status, properties and log of your
SQL Stream jobs executed in Cloudera SQL Stream Builder. Using the Flink Dashboard, you can also monitor
the Flink job that is submitted when you execute a SQL query.
Using the Streaming SQL Console
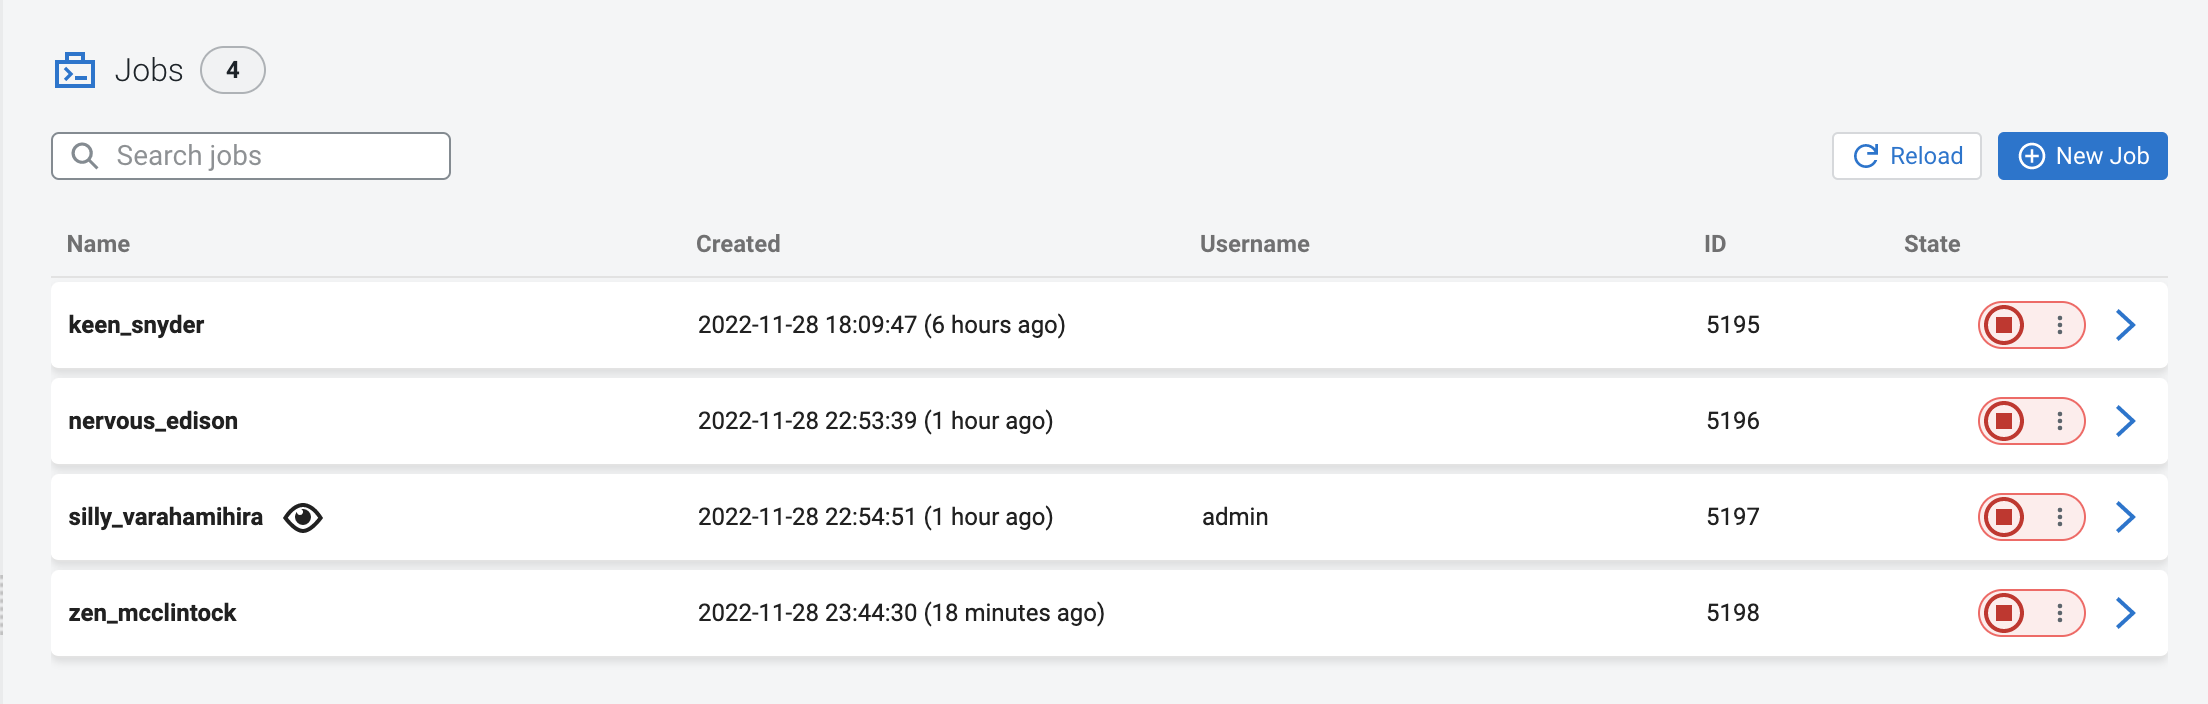
When using the Jobs tab in Streaming SQL Console to monitor your SQL
jobs, you can review the ID, the Name, the Start time, the State of the submitted jobs, and
the User who submitted the SQL job.
Click next to Jobs.
Select Manage.
By default, all of the jobs are displayed on
the Jobs tab.
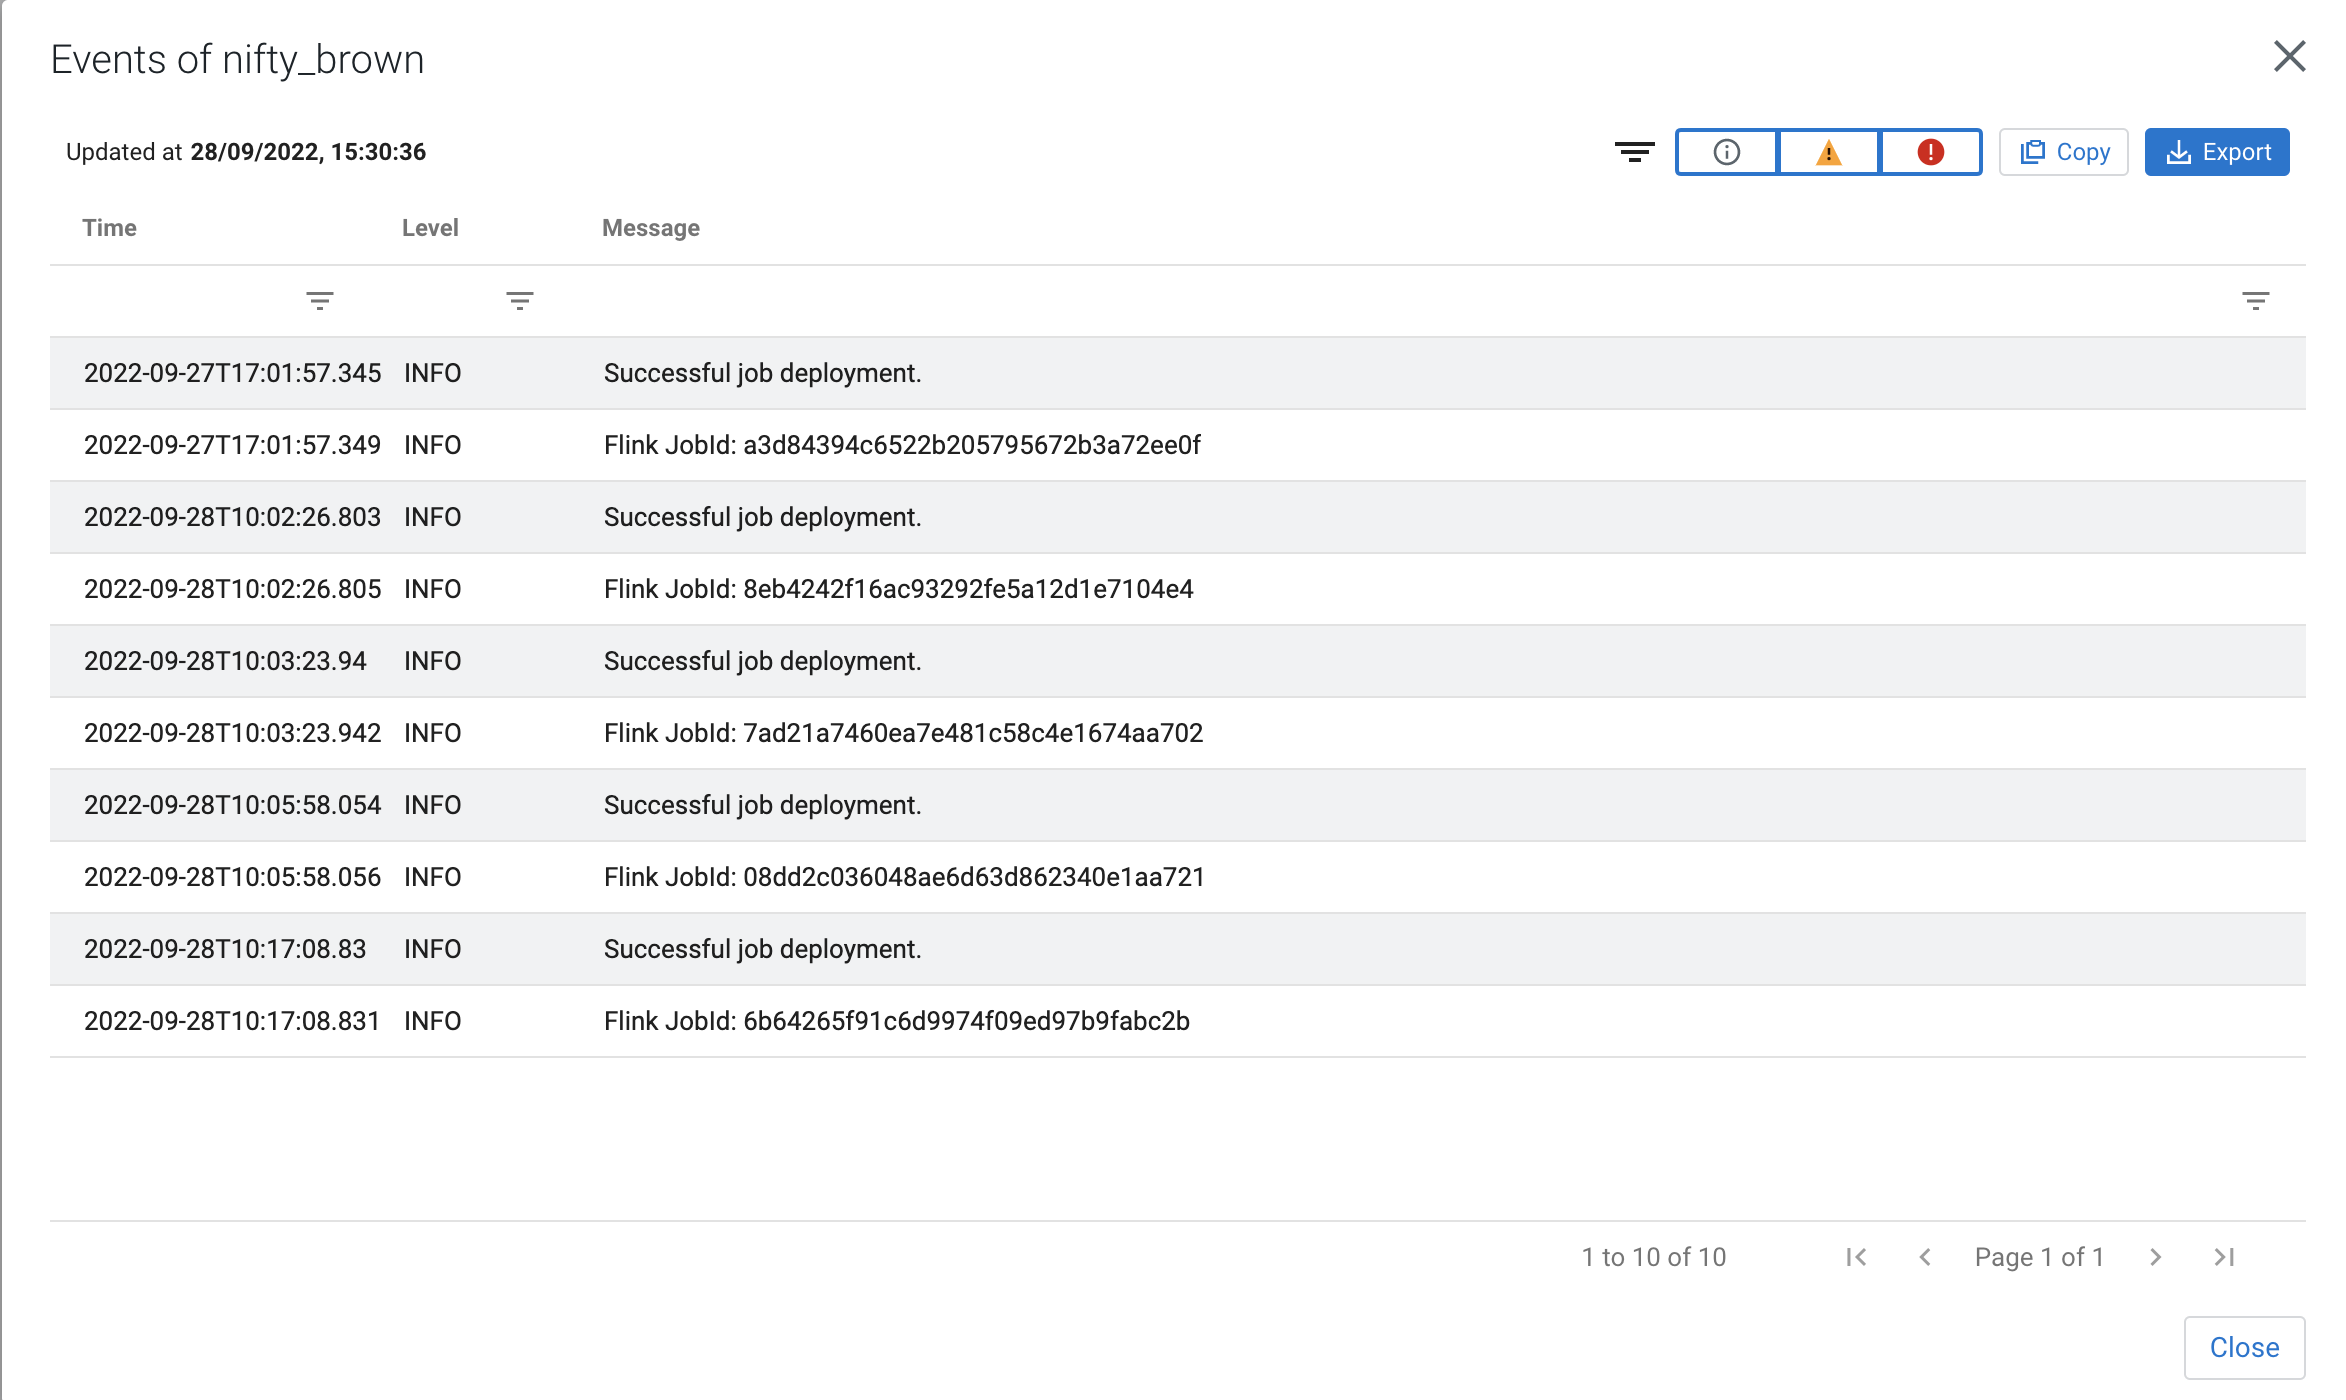
Click .
Select Events.
The Events window appears
detailing the Flink job information that can be further filtered based on the log
level settings.
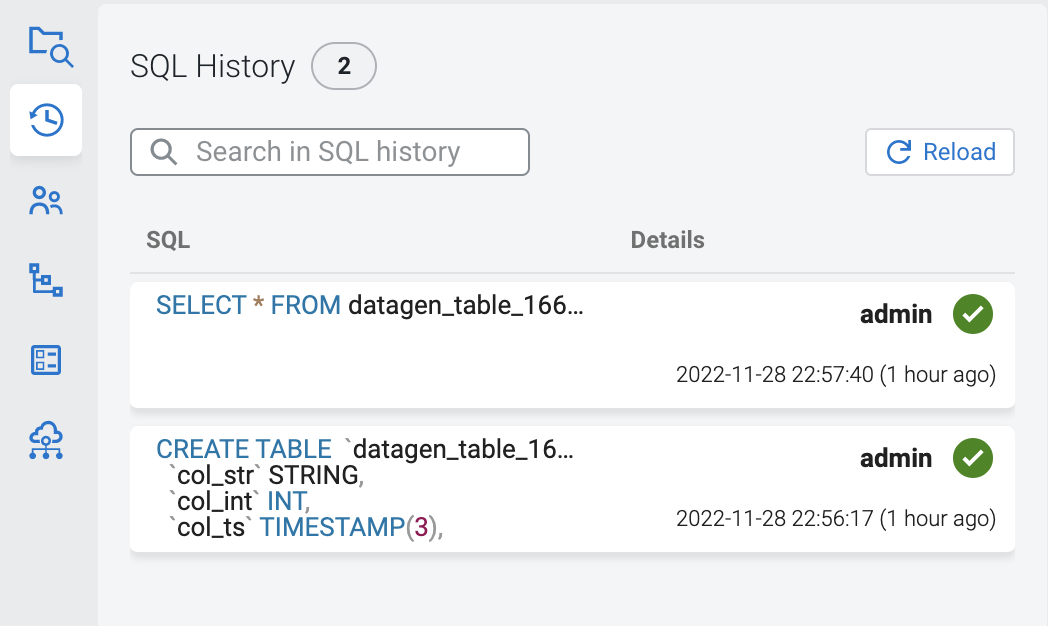
History of SQL queries
You can review and reuse the SQL queries that were previosuly executed on the SQL
History view of the Project Manager. When you click on one of the SQL queries,
it is automatically imported to the SQL window for execution. You can filter the SQL queries
by the time they were last run or by the user who run them.
Using the Flink Dashboard
You can also monitor your running SQL jobs using the Flink Dashboard. You can easily reach
the Flink Dashboard from the main menu of Streaming SQL Console or from the SQL Editor.
 next to Jobs.