The Flink Dashboard is a built-in monitoring interface for Flink applications in
Cloudera Streaming Analytics. You can monitor your running, completed and stopped Flink jobs on
the dashboard. You reach the Flink Dashboard through Cloudera Manager.
After deploying Flink and the required components, you can configure and monitor each component
individually, or the whole cluster with Cloudera Manager. For the general use of Cloudera
Manager, see the Cloudera Manager documentation.
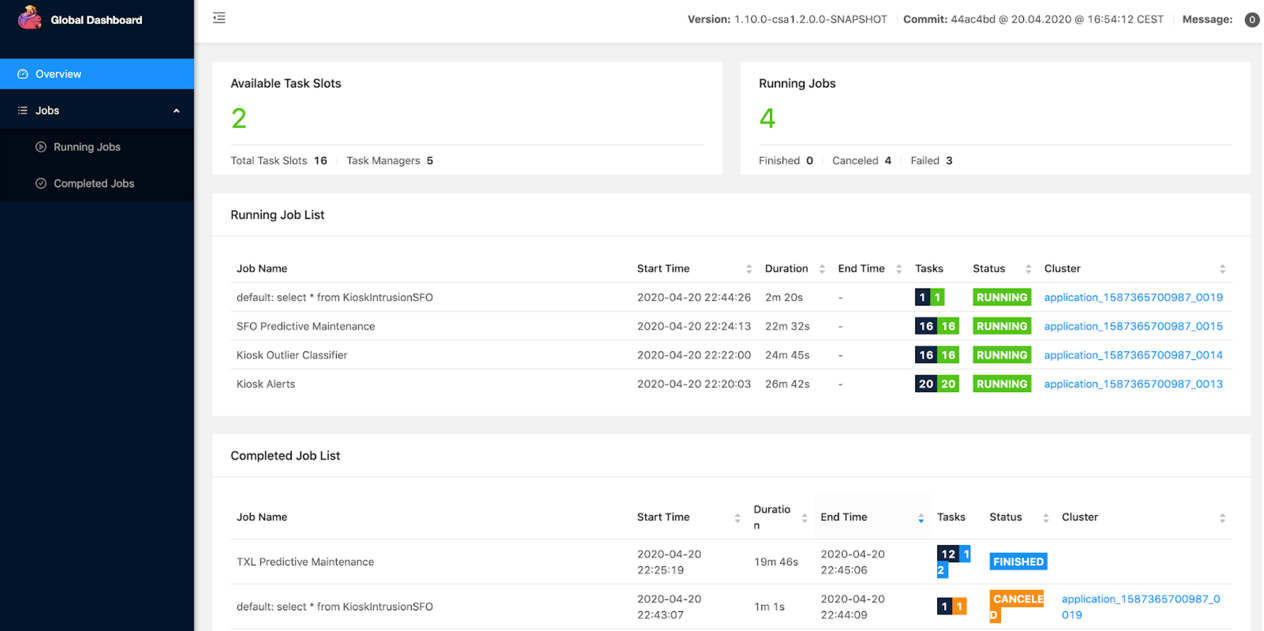
The Flink Dashboard acts as a single UI for monitoring all the jobs running on the YARN
cluster. It shows all the running, failed, and finished jobs.
You can also use the dashboard to navigate between the different Flink clusters from a central
place.