Steps for displaying a table's metadata that could be causing a query to run slowly.
Describes how to display the metadata of table used in your query, such as the
table's file size distribution that could be causing your query statement to run
slowly.
In a supported browser, log in to the Workload XM web UI by doing
the following:
In the web browser URL field, enter the Workload XM URL that
you were given by your system administrator and press
Enter.
When the Workload XM Log in page opens, enter your Workload XM user name and password access credentials.
Click Log in.
In the Search field of the Clusters page, enter the name of the cluster whose
workloads you want to analyze.
From the navigation panel under Data Warehouse, select
Summary.
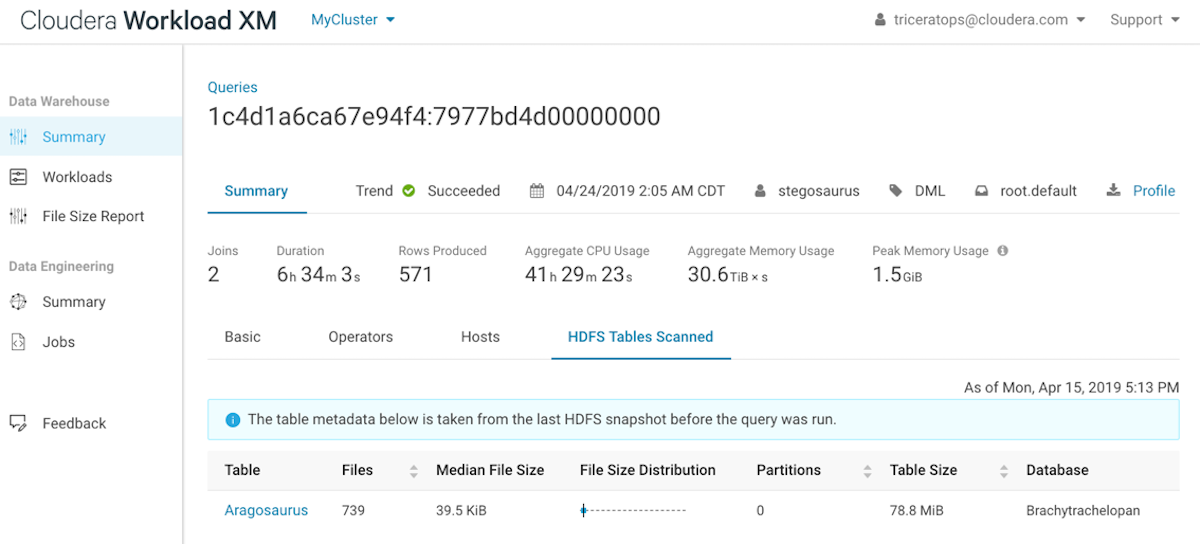
In the Queries page, select the query of interest and then select the
HDFS Tables Scanned tab.
For example, the Duration column shows that the query
took over six hours to run and the HDFS Tables Scanned
section displays the metadata for the tables that were scanned.
To display the file size distribution details for a table, click the Table name
.
We want your opinion
How can we improve this page?
What kind of feedback do you have?
This site uses cookies and related technologies, as described in our privacy policy, for purposes that may include site operation, analytics, enhanced user experience, or advertising. You may choose to consent to our use of these technologies, or