Troubleshooting with the Job Comparison Feature
Steps for comparing two different runs of the same job, which is especially useful when you notice unexpected changes. For example, when you have a job that consistently completes within a specific amount of time and then it starts taking longer, comparing two runs of the same job enables you to analyze the differences so that you can troubleshoot the cause.
Steps with examples are included that help explain how to further investigate and troubleshoot.
-
Examine the list of jobs that have executed during the selected time period:
For example, as shown in the following image, the last three runs of the
spark-etljob have taken significantly longer to complete than usual. Where, on August 2, the duration was 27 minutes, but on August 3, the duration almost doubled to 51 minutes: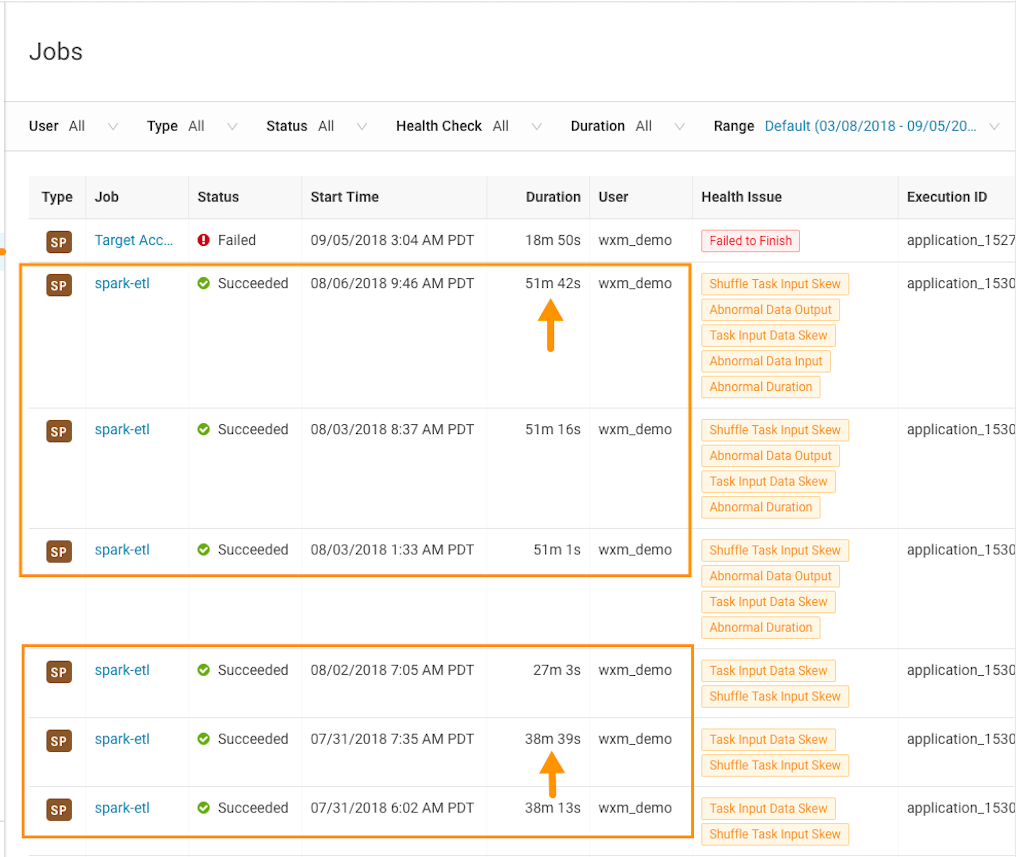
-
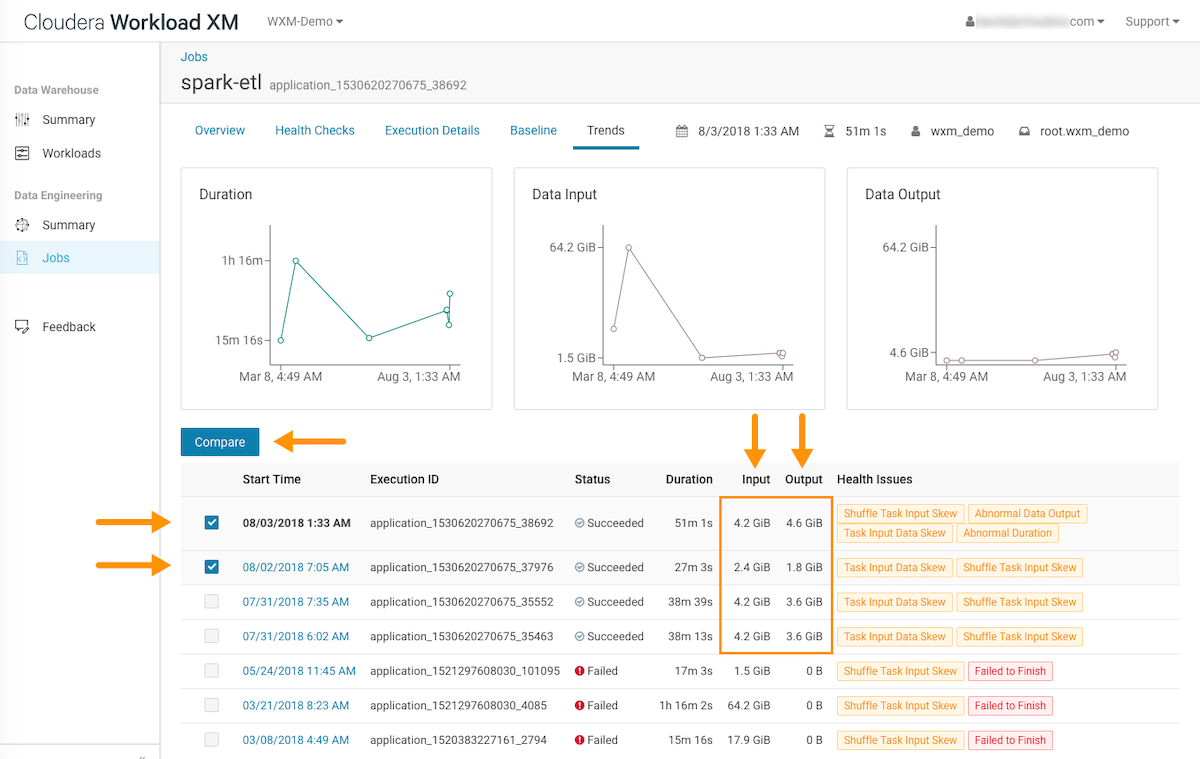
List and display details of all the runs of a specific job, by selecting one of
the job runs and then in the Jobs details page, click the
Trends tab.
In the following example, notice how the amount of data changes in the Input and Output columns. Where, on August 2, the job processed 2.4 GB of data, but on August 3, the job processed 4.2 GB, which is almost twice as much data. The Job Comparison tool will enable you to examine both runs to determine why the amount of data changed:
-
To compare two job runs, select the check boxes adjacent to the job runs you
require, in this case the runs for August 2 and August 3 are selected, and then
click Compare.
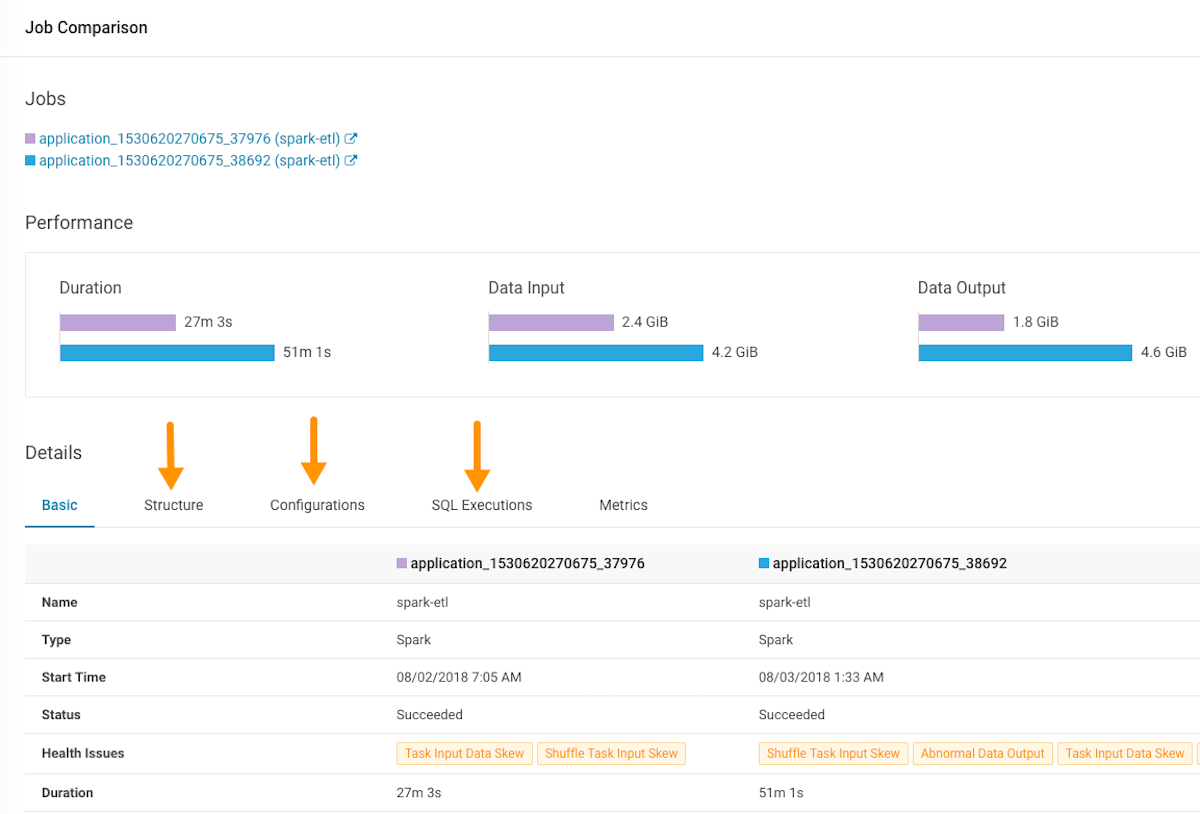
The Job Comparison page opens displaying more details about each job.For this example's comparison, the tabs that contain more information about the job runs are the Structure, Configurations, and the SQL Executions tabs:
-
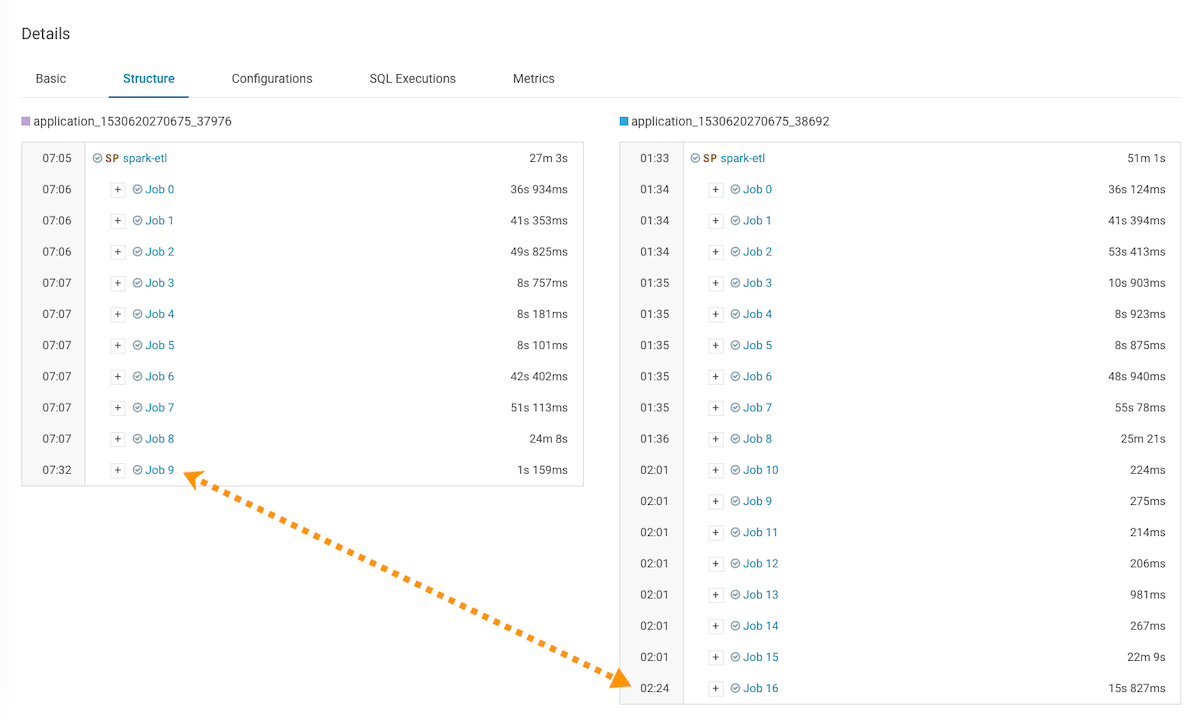
Display the sub-jobs executed for both of your selected job runs by selecting
the Structure tab.
For example, as shown in the following image, the job that took 27 minutes only executed 9 sub-jobs and the job that took 51 minutes, almost twice as much time, executed 16 sub-jobs, almost twice as many. Clicking any of the listed sub-jobs displays more details.
-
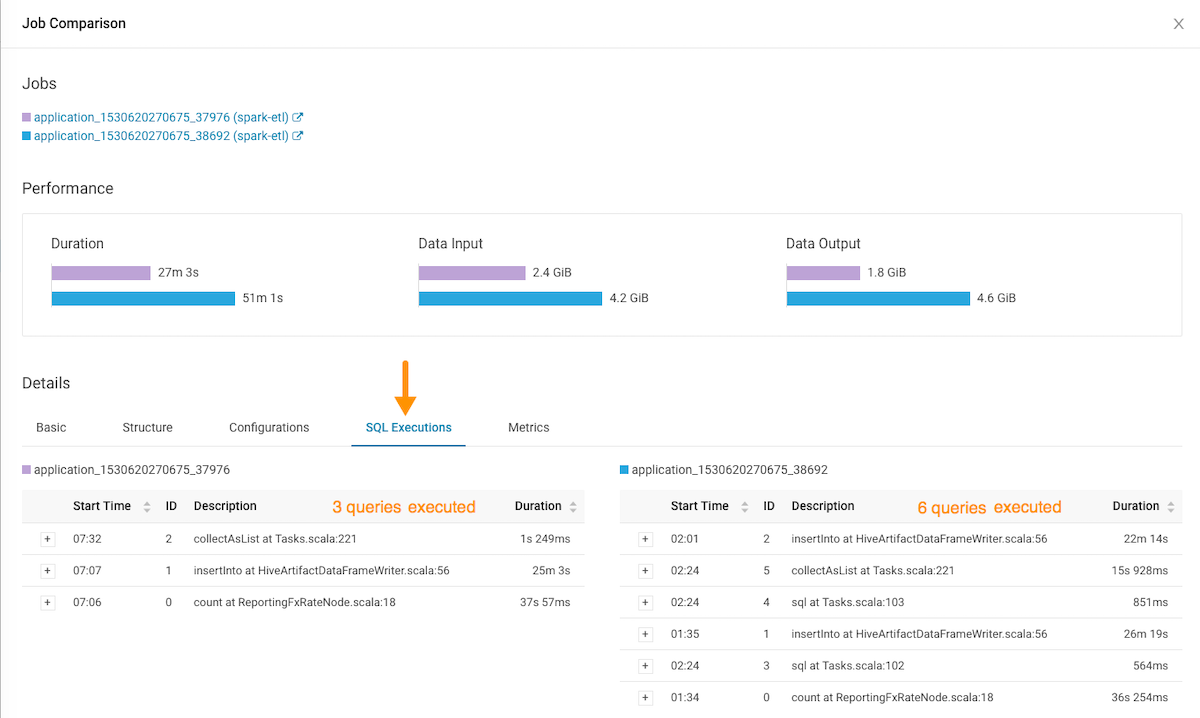
Display the number of SQL executions by selecting the SQL
Executions tab.
For our example, as shown by the following image, twice as many Spark queries executed for the job that took the longest duration.