Monitoring deployments in Cloudera Edge Management
Learn about the options available on the Dashboard screen that enable you to monitor C2 server and agent deployments. The Dashboard is the default landing page in the Edge Flow Manager UI.
The Dashboard allows you to monitor deployments effectively by offering real-time insights into agent health, flow updates, and command status. By fetching more details, you can drill down into specific metrics and alerts to ensure optimal deployment health and performance.

Cloudera Edge Management provides the following details for deployments:
Status
- Good Health: Recent heartbeats are received from all agents in the agent class.
- Concerning Health: Some agents have not sent a
heartbeat within the time period defined by the
efm.monitor.maxHeartbeatInterval. - Bad Health: None of the agents sent heartbeats in the
given class for the time period defined in
the
efm.monitor.maxHeartbeatInterval. - Unknown Health: The agents in the class may not yet be registered, or the heartbeat intervals cannot be determined.
If there is an orange dot next to the status icon, that indicates there are alerts associated with the agent class.
Possible alert messages:
-
A recent heartbeat has not been received for [a number of] agents. - You can click View Recent Alerts to learn more about the issue.
-
Errors occurred during previous flow publishing. - This lists the most frequent errors since the last publish. The number in brackets indicates how many times the error occurred. You can click the View Errors to learn more about the issues.
-
Agent Class contains agents with expiring certification within 30 days. - This notifies you that the certification of an agent will expire soon and you should renew it. You can click View Recent Alerts to learn more about the issue. Once the renewal is addressed, the alert disappears.
Class Name
This column displays the name of the agent class being monitored.
Number of Agents
This column shows the total count of assigned agents (both online and missing) for the given agent class.
Last Flow Updated
This column indicates the timestamp of the most recent flow update for the specified agent class.
Updated Agents
This column shows the status of the last batched command (for example flow publish or property update). Batched commands cannot fully complete if there are missing agents in the class.
Arrow
- Metrics: Displays performance metrics for the deployment.
- Alerts: Shows any alerts or issues that require attention.
- Resources
Monitoring class details in the Metrics tab

- Flow Definition
-
This section displays details about the class including flow ID and published flow version.
- Dashboard
-
This section displays alink to the Grafana dashboard, if it has been enabled. For more information, see Monitoring Metrics with Grafana.
- Repositories (Class Average)
-
This section displays the average usage details of the repositories across agents in the agent class.
- Connection Queues (Class Average)
-
This section shows an aggregate view of all connections across the agents in the selected class.
Monitoring alert details in the Alerts tab
Click the arrow icon on the Dashboard page to access more detailed information a your deployment on the Metrics and Alerts tabs. Alert messages associated with the agent class are available on the Alerts tab.

You can scroll through the alerts to view additional messages in the system. Each alert includes an arrow icon that you can click to fetch more details about the alert.

Actions
The Actions menu provides various commands and tools for managing agent classes.

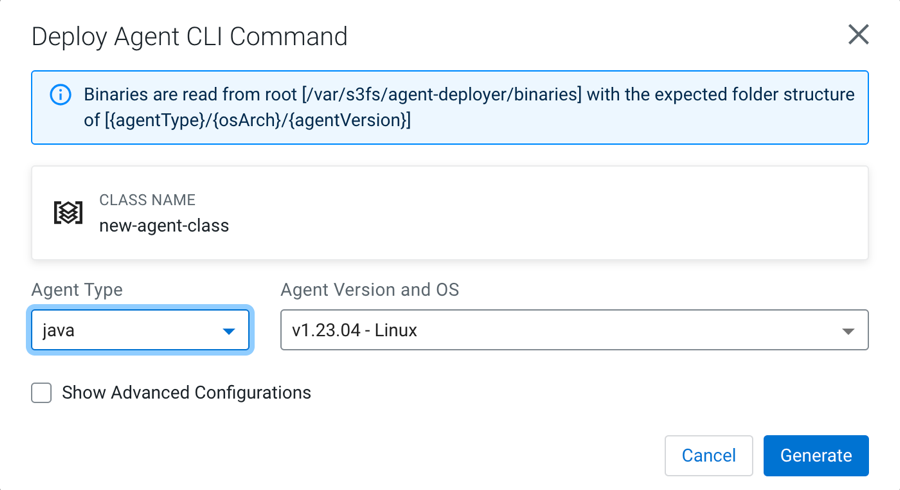
Deploy Agent CLI Command
This option allows you to deploy specific agent commands through the command-line interface (CLI). It provides flexibility for advanced operations or troubleshooting tasks that are not available through the UI.
Manage Agents
To view the list of agents assigned to the selected agent class, click Manage Agents from the Actions menu.
For more details about how to manage agents, see Managing agents in Cloudera Edge Management.
Import Flow
Use this option to import a pre-existing flow into the agent class.
Export Flow
Use this option to export the current dataflow associated with the agent class. Exported flows can be shared or stored for backup purposes.
Delete Agent Class
Use this action to remove an entire Agent Class.
Edit Agent Configuration
This action allows you to modify agent properties through the Edge Flow Manager.