Monitoring events in Cloudera Edge Management
Learn about the options available on the Edge Events screen that enable you to monitor C2 server and agent events.
The Edge Events interface allows you to monitor events effectively by providing detailed information on event type, severity, and source. You can gain deeper insights to ensure optimal system performance and address issues proactively. With options for sorting, filtering, and time-based views, you can analyze and manage events across your deployments. You can also access metrics and alert details from this page.
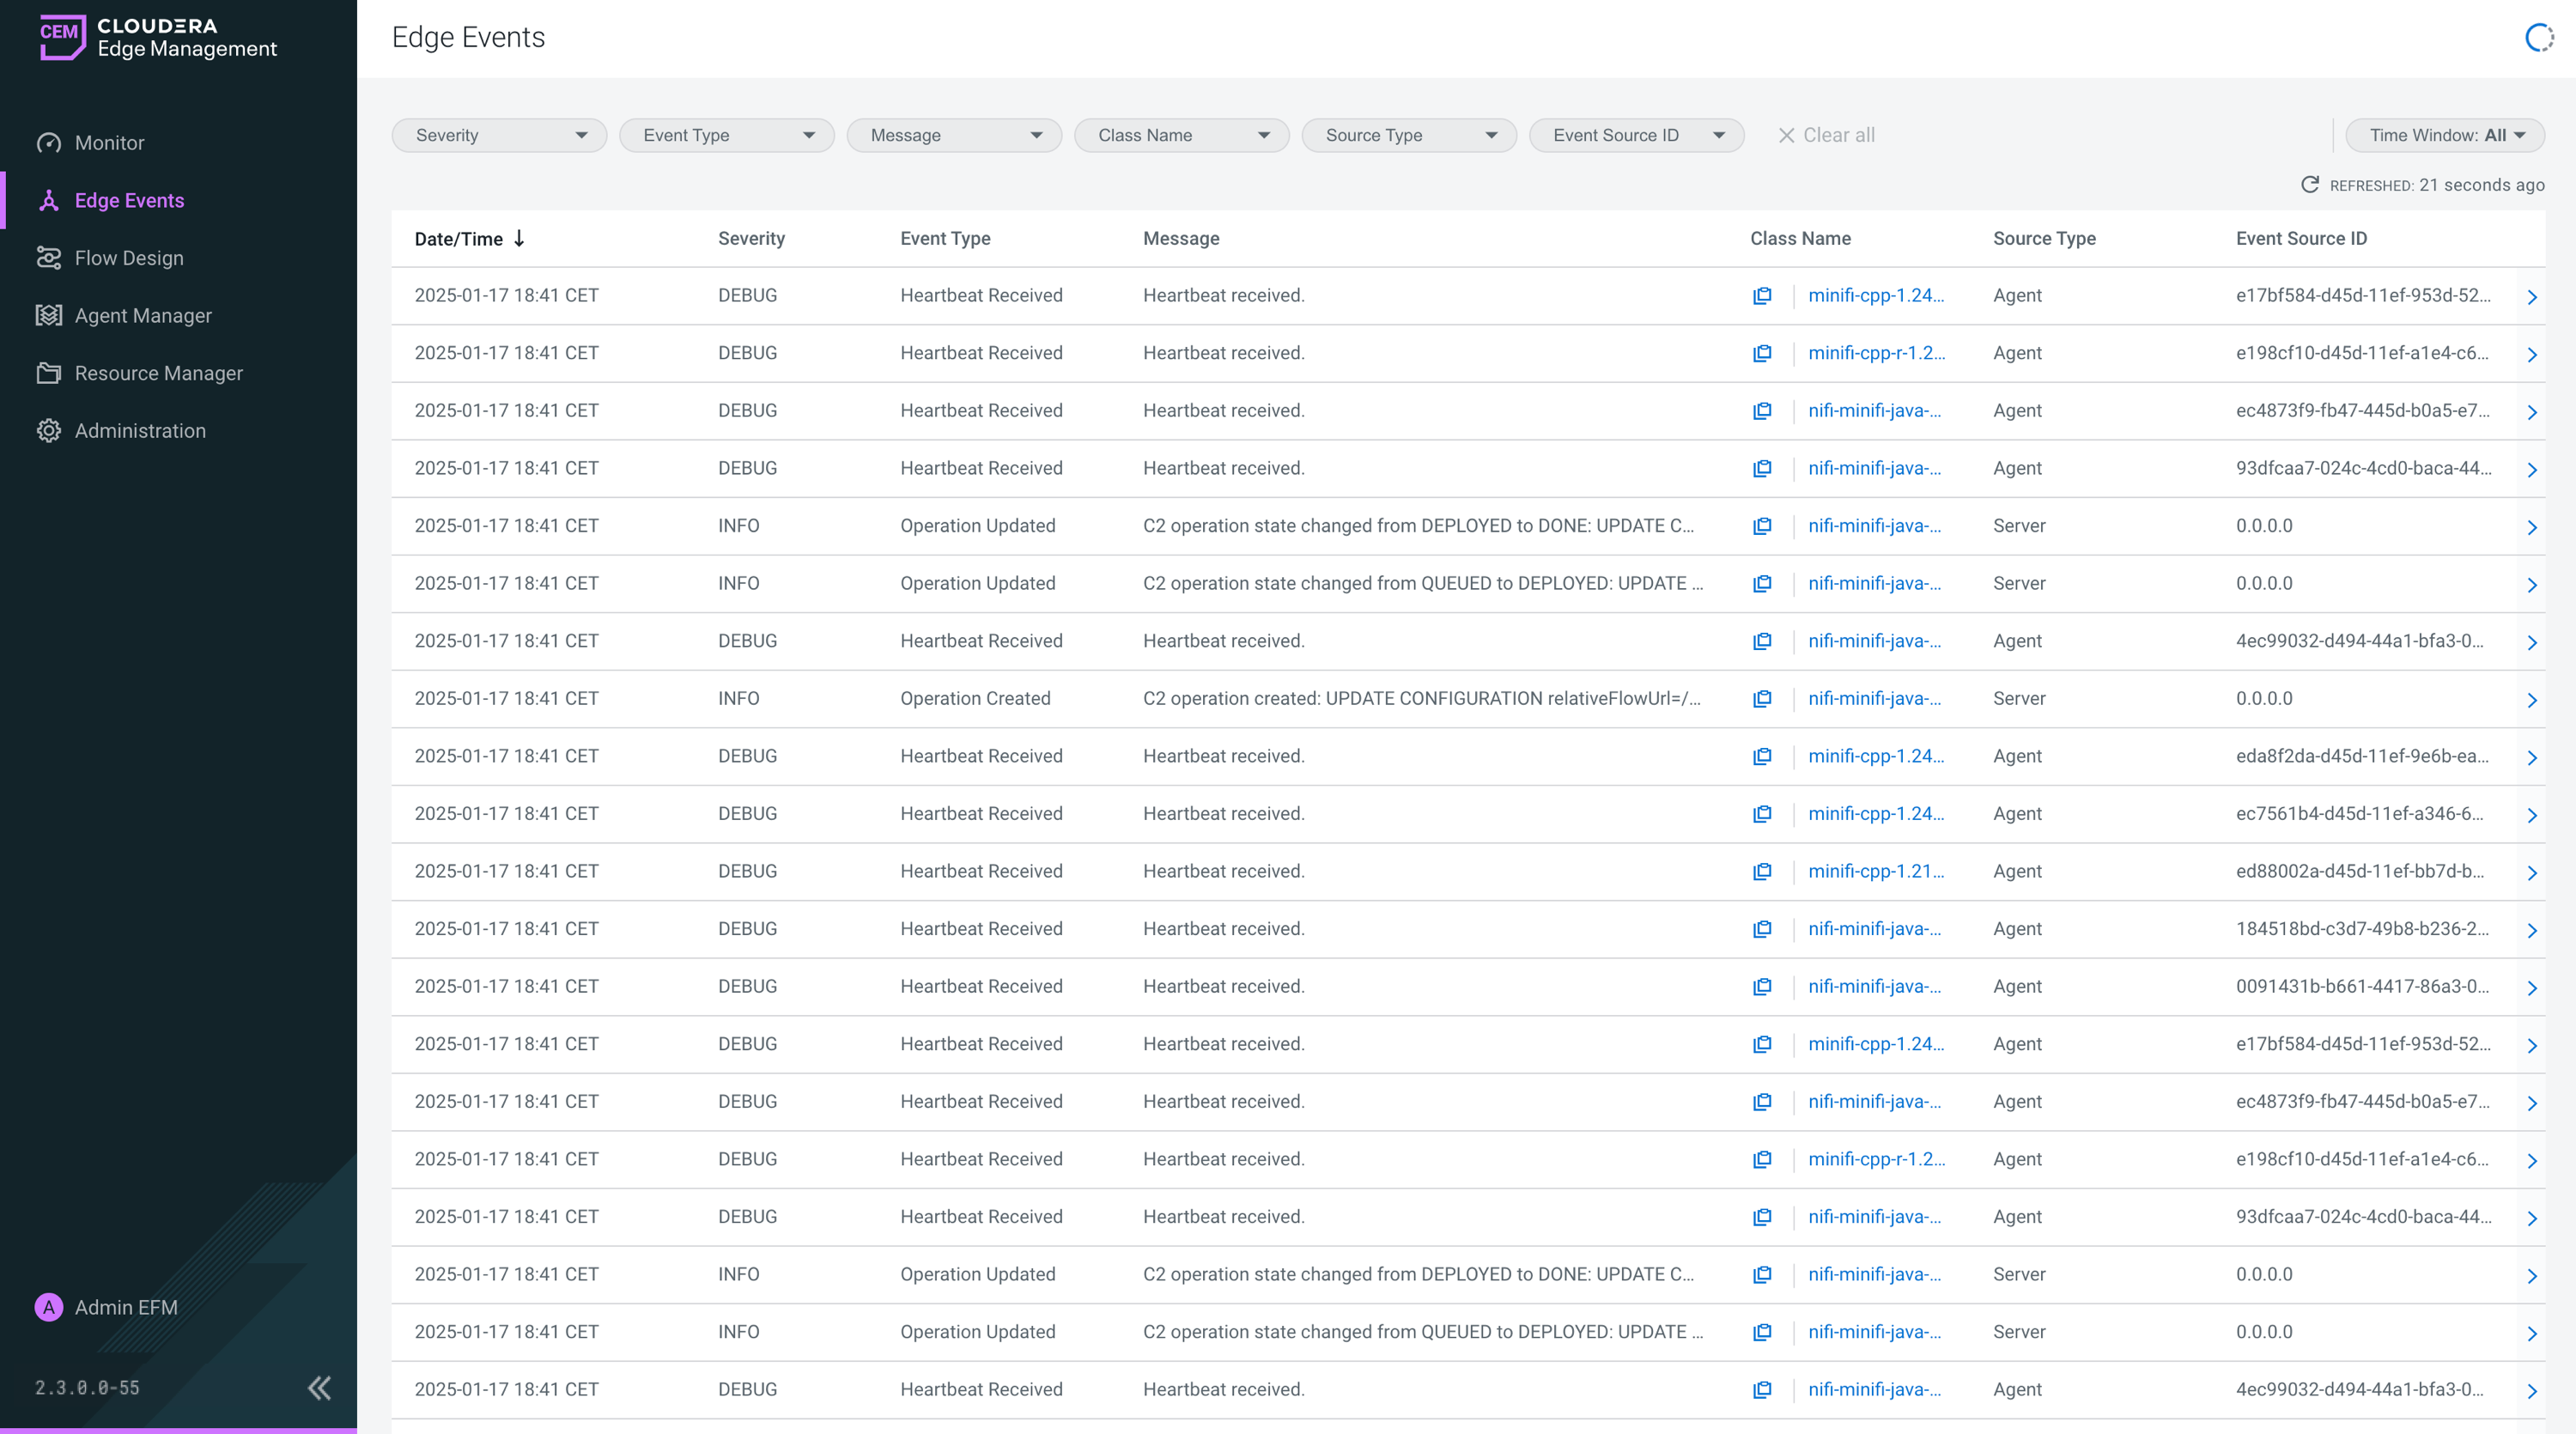
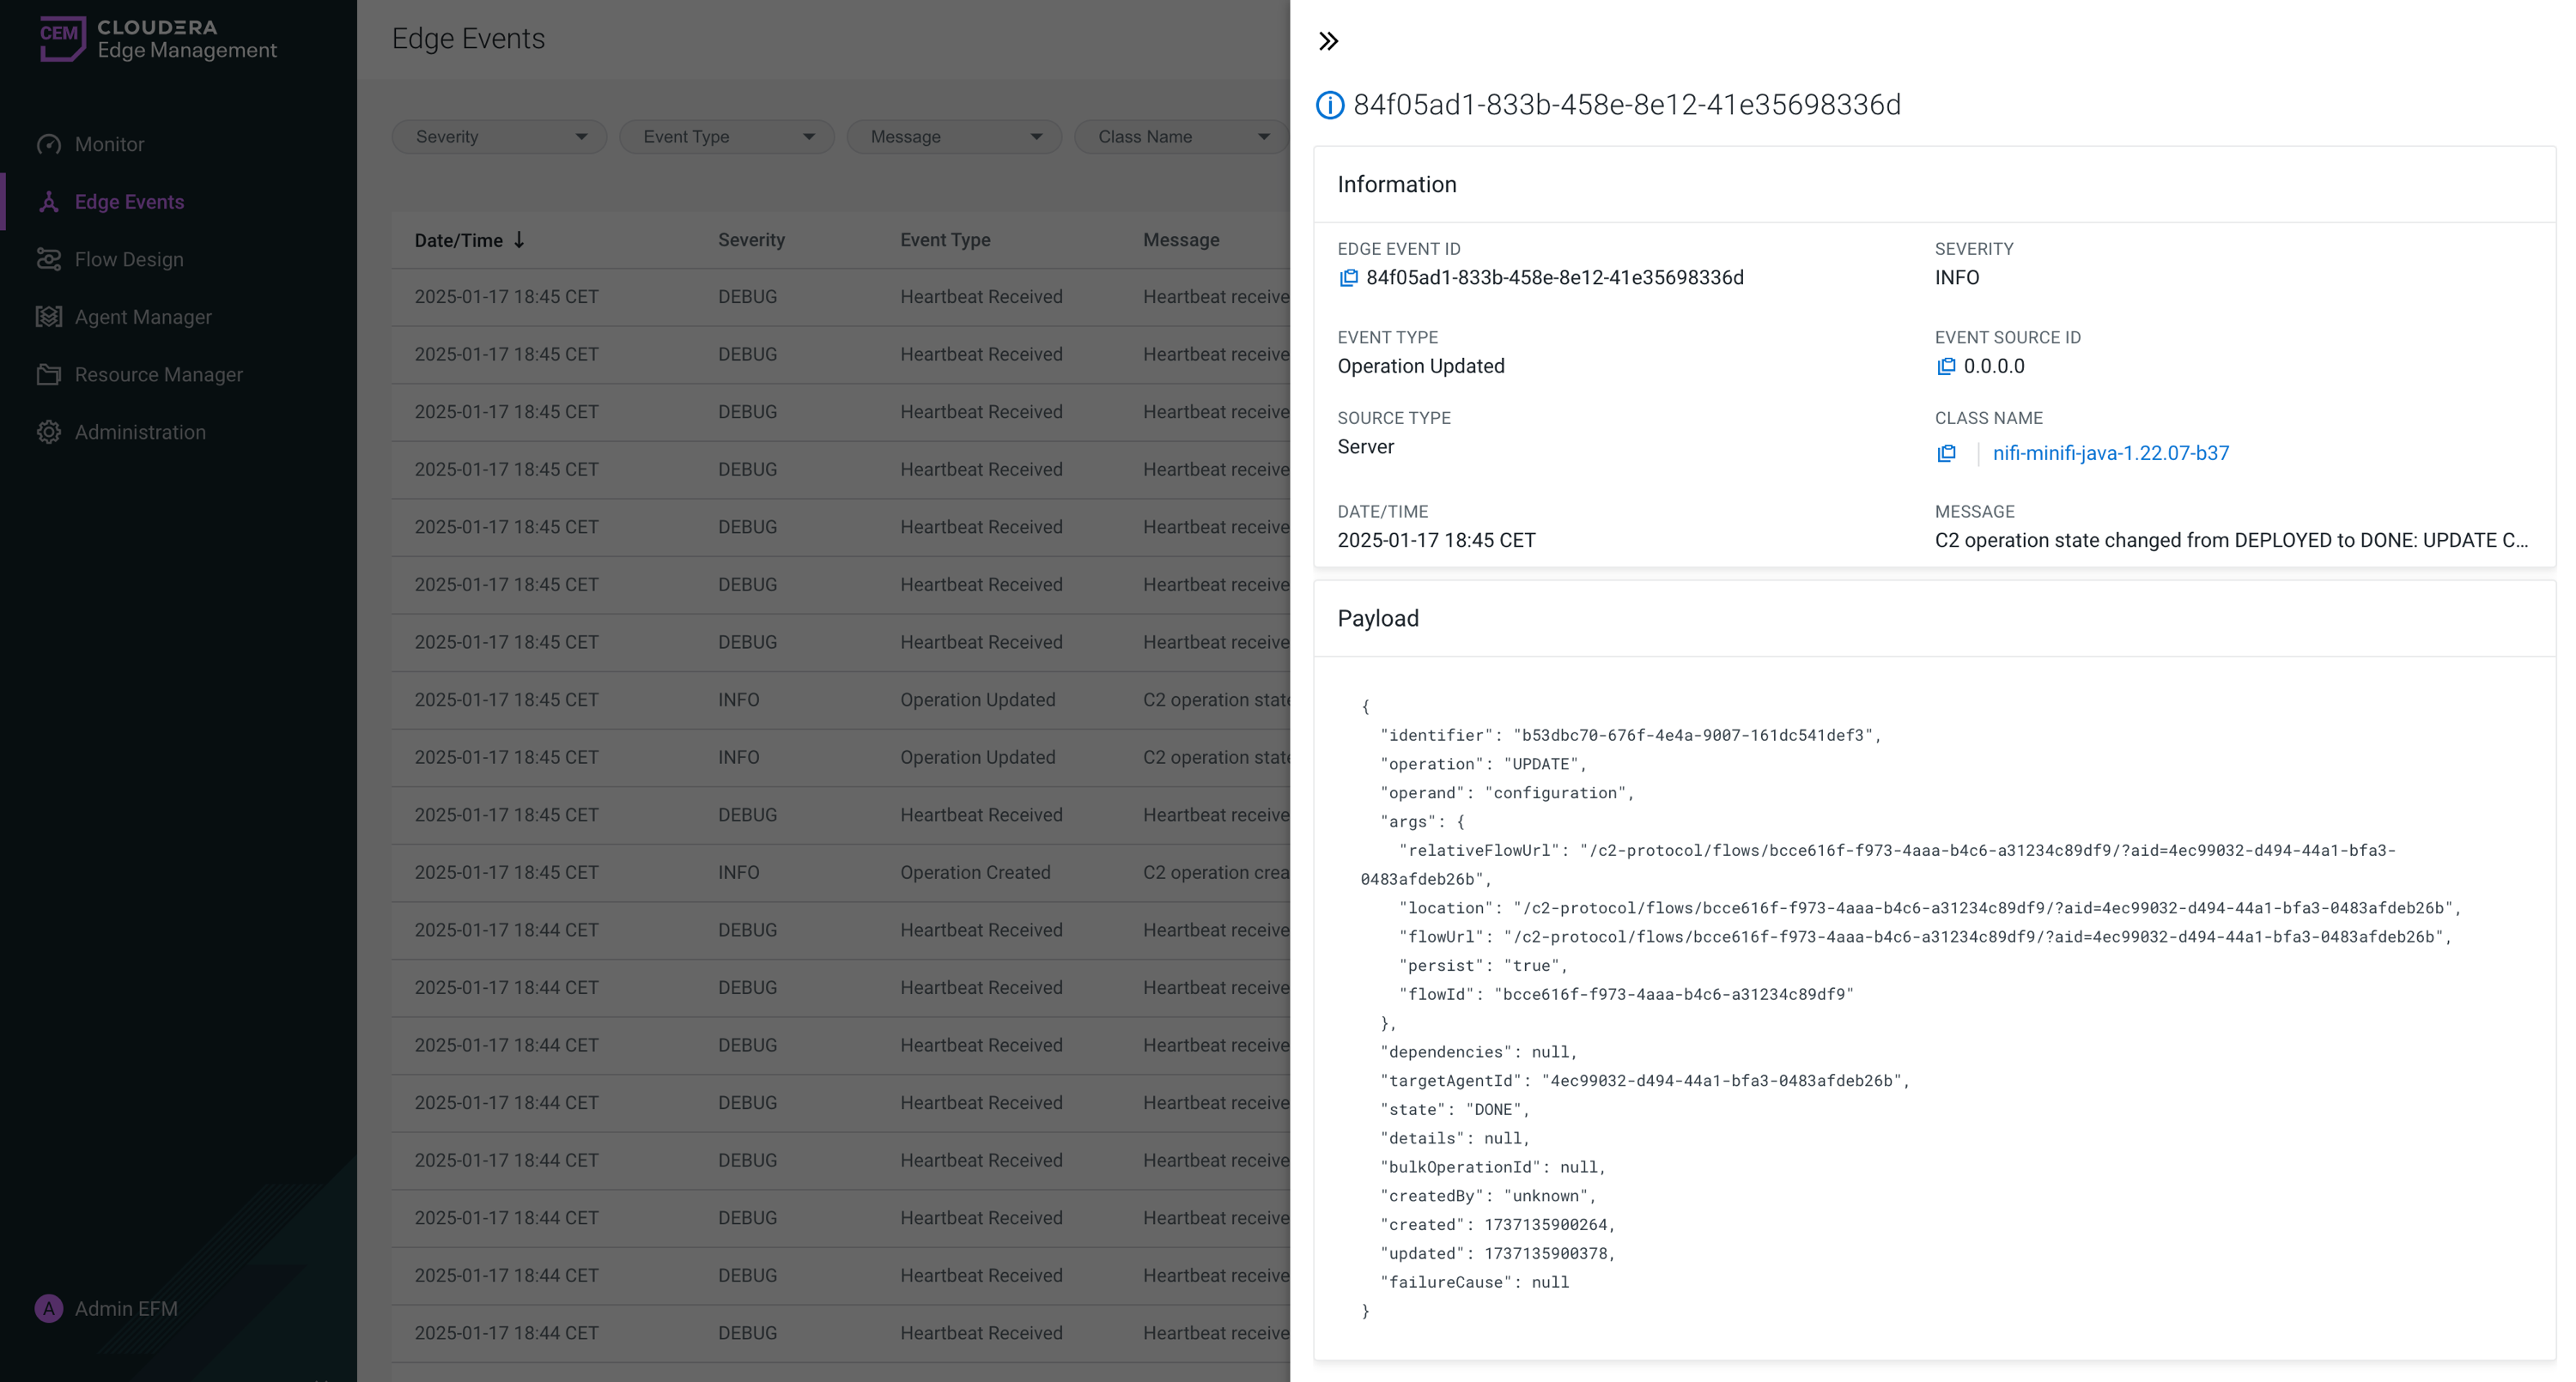
- Date/Time: The timestamp when the event occurred.
- Severity: It indicates the event's level of importance (for example: DEBUG, ERROR, INFO, ALERT).
- Event Type: The category of the event (for example: Heartbeat Received).
- Message: A short description of the event.
- Class Name: The agent class associated with the event. Clicking the value in this field opens the Metrics tab from the Details pane of a deployment on the Dashboard, allowing you to track detailed metrics and alerts for the class.
- Source Type: It indicates whether the event originates from an agentor another source.
- Event Source ID: A unique identifier for the event source.
The number of rows displayed on a page can be configured (20, 50, or 100) using the Rows per page drop-down option in the bottom-right corner.
For detailed information about a specific event, click the arrow at the end of the event row. A pane will appear, displaying the event's detailed information. To view updates, click Show now next to the Updates are available message in the upper-right corner of the screen.
Sorting and filtering options
- Sorting
-
Click a column name to sort events in ascending or descending order.
- Filtering
- Use the filter fields at the top of the screen to narrow down the list of events. You can also filter the events by Severity, Event Type, Message, Class Name, Source Type, Event Source ID, and Time Window.
The Severity and Class Name filters provide drop-down menus with predefined options, allowing you to select from available values using checkboxes. This ensures consistency and accuracy for fields with a fixed set of valid options. Similarly, Time Window offers predefined values to refine the event list based on a preferred time range. You can choose from the following options:
- All
- Last Hour
- Last 4 Hours
- Last 24 Hours
- Last 7 Days
- Since Last Publish
The other filters, like Event Type or Message, include a free-text field. They allow you to enter custom values filtering data that can vary widely and cannot be predefined. Once you have entered or selected a value, press Enter on your keyboard to apply the filter and update the event list.
You can apply filters to multiple columns simultaneously to refine your data further. After applying filters, you can share the URL with others so they can view the same filtered event list.
Event details