
Showing Atlas Server status
Cloudera Manager shows the status of the Atlas Server role running in a given cluster. To understand if the Atlas UI is up and working for users, check the health of the other services on which Atlas depends: HBase, Kafka, and Solr.
The high-level status that Cloudera Manager shows for Atlas indicates the health of the Atlas Service. If you are experiencing problems with the Atlas UI or with metadata not showing up as expected, check to make sure the dependent services are also healthy.
To view the high-level status of Atlas and its dependent services:
- Open the Cloudera Manager Admin Console.
 From CDP Public Cloud, access Cloudera Manager through your Data
Lake.
From CDP Public Cloud, access Cloudera Manager through your Data
Lake. From CDP Private Cloud Base, access Cloudera Manager directly in your browser.
- Choose
.
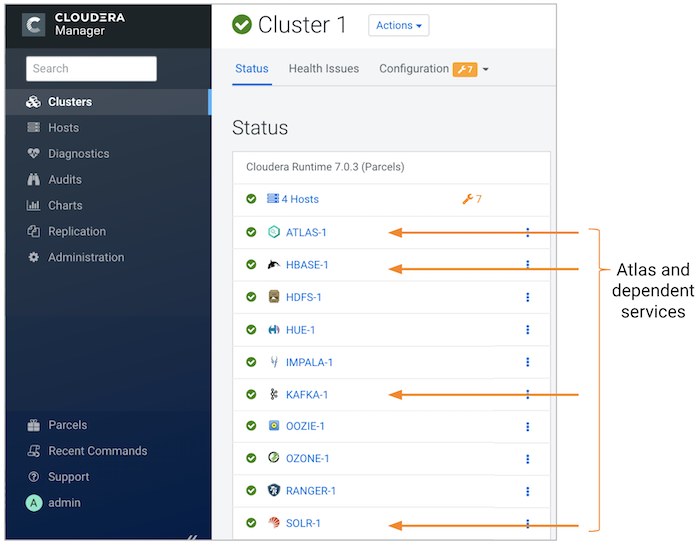
The cluster detail page shows the high-level status of each service.
Check Atlas, HBase, Kafka, and Solr.
Understanding Atlas status
The Atlas status bubbles up to a single health indicator, which appears
in many places including the service name  .
.
To see more detail of the Atlas status:
- Click the links in the top-level status to drill into the recent health tests and events.
- Drill into specific health test to open the detail page for the test.
If the Atlas status is anything but a green check for "healthy", you
can use the content of the page to identify the problem. Check the following:
- If Atlas is stopped, was it stopped deliberately or did it shutdown on its own? To restart the service, see Restarting a Cloudera Runtime Service. To review what may have caused Atlas to shutdown, click the status icon to open a more detailed list of recent events.
- If Atlas shows a red exclamation point for "bad" health, check to see if one of the services it depends upon is stopped: HBase, Kafka, and Solr all run in the same cluster to support Atlas.
