Cluster Utilization Reports
The Cluster Utilization Report screens in Cloudera Manager display aggregated utilization information for YARN and Impala jobs. The reports display CPU utilization, memory utilization, resource allocations made due to the YARN fair scheduler, and Impala queries. The report displays aggregated utilization for the entire cluster and also breaks out utilization by tenant, which is either a user or a resource pool. You can configure the report to display utilization for a range of dates, specific days of the week, and time ranges.
The report displays the current utilization of CPU and memory resources and the resources that were allocated using the Cloudera Manager resource management features. See Resource Management.
Using the information displayed in the Cluster Utilization Report, a CDH cluster administrator can verify that sufficient resources are available for
the number and types of jobs running in the cluster. An administrator can use the reports to tune resource allocations so that resources are used efficiently and meet business requirements. Tool tips
in the report pages provide suggestions about how to improve performance based on the information displayed in the report. Hover over a label to see these suggestions and other information. For
example:
- CPU and memory allocations
- Weights for each pool
- Scheduling rules
- Preemption thresholds
- Maximum number of running and queued Impala queries
- Maximum timeout for the queue of Impala queries
- Placement rules
- Number of hosts in a cluster
- Memory capacity of hosts
- Impala Admission Control pool and queue configurations
The Cluster Utilization Report is only available with Cloudera Manager 5.7 and higher and CDH 5.7 and higher.
If you want to create your own reports with similar functionality, or if you want to export the report results, see Creating a Custom Cluster Utilization Report.
Configuring the Cluster Utilization Report
This topic describes the prerequisites and configurations required to use the Cluster Utilization Report.
Enabling the Cluster Utilization Report
By default, the Cluster Utilization Report displays aggregated CPU and memory utilization for an entire CDH cluster and for YARN and Impala utilization. You can also view this utilization by tenants, which include Linux users and Dynamic Resource Pools. To see utilization for a tenant, you must configure the tenant and define resource limits for it.
- Enable YARN utilization metrics collection.
- Go to the YARN Service
- Click the Configuration tab.
- Select .
- Type container in the Search box.
- Select the Enable Container Usage Metrics Collection parameter.
- Enter a username for the MapReduce job that collects the metrics in the Container Usage MapReduce Job User parameter. The username you enter must be a Linux user on all the cluster hosts. If you are using an Active Directory KDC, the username must also exist in Active Directory. For secure clusters, the user must not be banned or below the minimum user ID. You can view the list of banned users (banned.users) and the minimum user ID (min.user.id) by selecting .
- (Optional) Enter the resource pool in which the container usage collection MapReduce job runs in the Container Usage MapReduce Job Pool parameter. Cloudera recommends that you dedicate a resource pool for running this MapReduce job.
- Click Save Changes to commit the changes.
- Click the Actions drop-down list and select Create CM Container Usage Metrics Dir.
- Restart the YARN service:
- Go to the YARN service.
- Select .
- Enable Impala utilization collection.
- Go to the Impala service.
- Click the Configuration tab.
- Select .
- Select or clear both the Enable Impala Admission Control checkbox and the Enable Dynamic Resource Pools checkbox.
- Click Save Changes to commit the changes.
- Restart the Impala service.
Configuring the Cluster Utilization Report
To access the Cluster Utilization Report, go to and then select Utilization Report for the cluster. The Overview tab displays when you first open the report.
The upper-right part of the page has two controls that you use to configure the Cluster Utilization Report:

You can apply a configuration and date range that applies to all tabs in the report:
- Click the Configuration drop-down menu.
- Select one the configured options, or create a new configuration:
- Click Create New Configuration.
- Enter a Configuration Name.
- Select the Tenant Type, either Pool or User.
- Select the days of the week for which you want to report utilization.
- Select All Day, or use the drop-down menus to specify a utilization time range for the report.
- Click Create.
The configuration you created is now available from the Configuration drop-down menu.
- Select a date range for the report:
- Click the date range button.
- Select one of the range options (Today, Yesterday, Last 7 Days, Last 30 Days, or This Month) or click Custom Range and select the beginning and ending dates for the date range.
Using the Cluster Utilization Report to Manage Resources
To access the Cluster Utilization Report, go to and then select Utilization Report for the cluster. The Overview tab of the report displays.
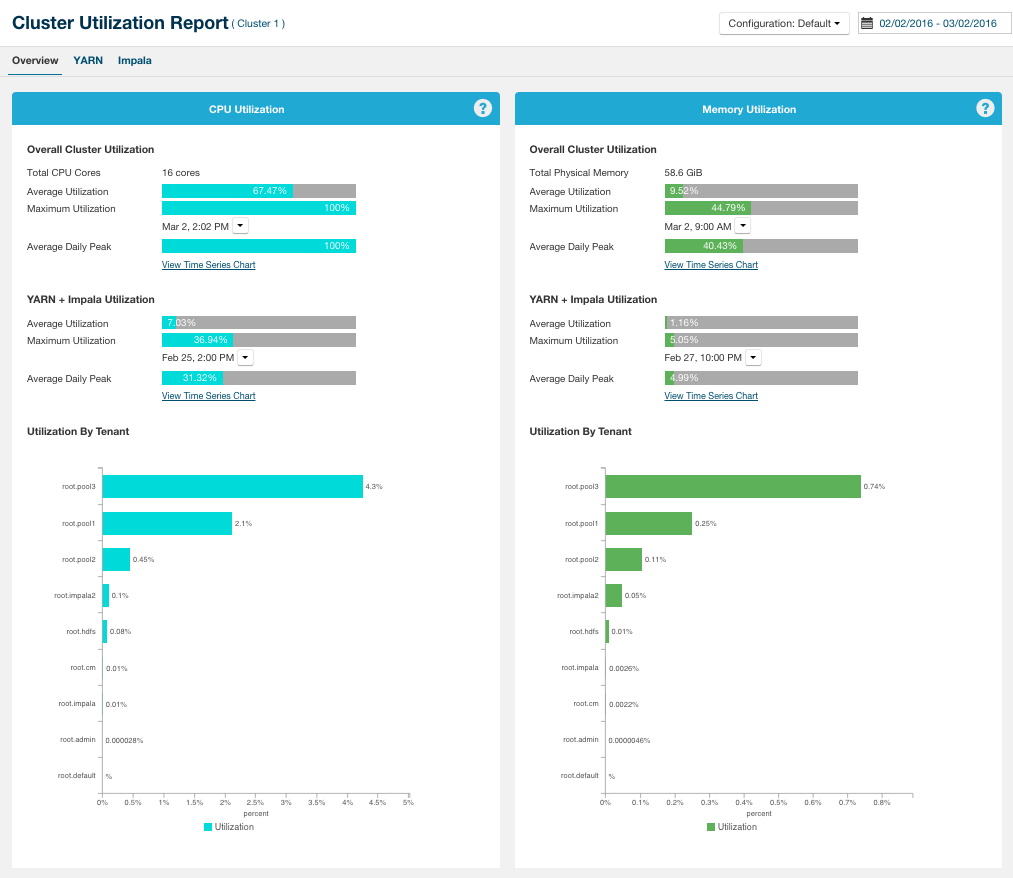
Overview Tab
| CPU Utilization | Memory Utilization |
|---|---|
Overall Cluster Utilization
|
Overall Cluster Utilization
|
YARN + Impala Utilization
|
YARN + Impala Utilization
|
| Utilization by Tenant
Displays overall utilization for each tenant. Tenants can be either pools or users. See Configuring the Cluster Utilization Report. |
Utilization by Tenant
Displays overall utilization for each tenant. Tenants can be either pools or users. See Configuring the Cluster Utilization Report. |
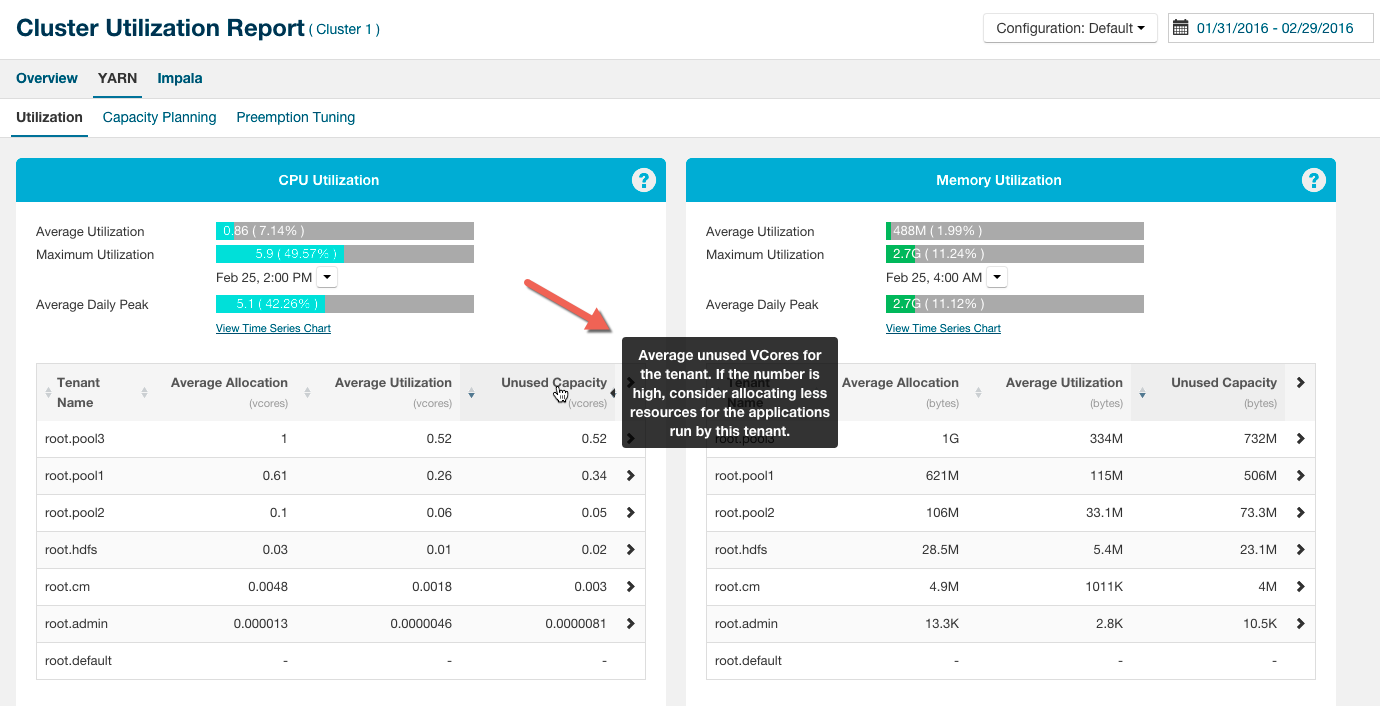
YARN Tab
Utilization Tab
| CPU Utilization | Memory Utilization |
|---|---|
Summary section:
|
Summary section:
|
| Utilization by Tenant
Displays overall utilization for each tenant. The tenants can be either pools or users. See Configuring the Cluster Utilization Report Utilization by tenant is displayed in a table with the following columns:
Click a column header to sort the table by that column. Click the |
Utilization by Tenant
Displays overall utilization for each tenant. The tenants can be either pools or users. See Configuring the Cluster Utilization Report. Utilization by tenant is displayed in a table with the following columns:
Click a column header to sort the table by that column. Click the |
Adjusting YARN Resources
- vcores: Container Virtual CPU Cores
- Memory: Container Memory
Capacity Planning Tab
- Tenant Name
- CPU Steady Fair Share – Displays the average number of CPU vcores allocated for each tenant based on the weights assigned to dynamic resource pools.
- Memory Steady Fair Share – Displays the average memory allocated for each tenant based on the weights assigned to dynamic resource pools.
- Wait Ratio During Contention – The wait ratio is the average percentage of containers in the YARN pool that were pending when there was at least one pending container in the pool. If a pool running critical applications has a high wait ratio, consider increasing the weight of that pool. If several pools in the cluster have a high wait ratio, consider adding more hosts to the cluster.
Click a column header to sort the table by that column.
Preemption Tuning Tab
The Preemption Tuning tab displays graphs for each tenant that display the average steady fair share allocations against the average instantaneous fair share allocations and average overall allocations for CPU and memory allocations.
- Enable fair scheduler preemption.
- Reduce the fair scheduler preemption utilization threshold.
- If you have configured a preemption timeout for a pool (on the Dynamic Resource Pool Configuration page (), reduce the length of the timeout for pools with a high wait ratio. See Dynamic Resource Pools.
The Memory section shows the average allocated memory, instantaneous fair share of memory, and steady fair share of memory whenever the YARN pool was facing contention with resources (times when there was at least one pending container). If the allocated memory is less than the Steady Fair Share during contention, consider making preemption more aggressive, as described previously for CPU.
Impala Tab
Queries Tab
The Overview tab displays information about Impala queries.
- Total – Total number of queries.
Click the link with the total to view details and charts about the queries.
- Avg Wait Time in Queue – Average time, in milliseconds, spent by a query in an Impala pool while waiting for resources. If this number is high, consider increasing the resources allocated to the pool. If this number is high for several pools, consider increasing the number of hosts in the cluster.
- Successful – The number and percentage of queries that finished successfully.
Click the link with the total to view details and charts about the queries.
- Memory Limit Exceeded – Number and percentage of queries that failed due to insufficient memory. If there are such queries, consider increasing the memory allocated to the pool. If there are several pools with such queries, consider increasing the number of hosts in the cluster.
- Timed Out in Queue – Number of queries that timed out while waiting for resources in a pool. If there are such queries, consider increasing the maximum number of running queries allowed for the pool. If there are several pools with such queries, consider increasing the number of hosts in the cluster.
- Rejected – Number of queries that were rejected by Impala because the pool was full. If this number is high, consider increasing the maximum number of queued queries allowed for the pool. See Admission Control and Query Queuing.
Click a column header to sort the table by that column.
Peak Memory Usage Tab
This report shows how Impala consumes memory at peak utilization. If utilization is high for a pool, consider adding resources to the pool. If utilization is high for several pools, consider adding more hosts to the cluster.
- Max Allocated
- Peak Allocation Time – The time when Impala reserved the maximum amount of memory for queries.
Click the drop-down list next to the date and time and select View Impala Queries Running at the Time to see details about the queries.
- Max Allocated – The maximum memory that was reserved by Impala for executing queries. If the percentage is high, consider increasing the number of hosts in the cluster.
- Utilized at the Time – The amount of memory used by Impala for running queries at the time when maximum memory was reserved.
Click View Time Series Chart to view a chart of peak memory allocations.
- Histogram of Allocated Memory at Peak Allocation Time – Distribution of memory reserved per Impala daemon for executing queries at the time Impala reserved the maximum memory. If some Impala daemons have reserved memory close to the configured limit, consider adding more physical memory to the hosts.
- Peak Allocation Time – The time when Impala reserved the maximum amount of memory for queries.
- Max Utilized
- Peak Usage Time – The time when Impala used the maximum amount of memory for queries.
Click the drop-down list next to the date and time and select View Impala Queries Running at the Time to see details about the queries.
- Max Utilized – The maximum memory that was used by Impala for executing queries. If the percentage is high, consider increasing the number of hosts in the cluster.
- Reserved at the Time – The amount of memory reserved by Impala at the time when it was using the maximum memory for executing queries.
Click View Time Series Chart to view a chart of peak memory utilization.
- Histogram of Utilized Memory at Peak Usage Time – Distribution of memory used per Impala daemon for executing queries at the time Impala used the maximum memory. If some Impala daemons are using memory close to the configured limit, consider adding more physical memory to the hosts.
- Peak Usage Time – The time when Impala used the maximum amount of memory for queries.
Spilled Memory Tab
The Spilled Memory tab displays information about Impala spilled memory. These disk spills can deteriorate the performance of Impala queries significantly. This report shows the amount of disk spills for Impala queries by tenant. If disk spill is high for a pool, consider adding resources to the pool. If disk spill is high for several pools, consider adding more hosts to the cluster.
- Average Spill – Average spill per query
- Maximum Spill – Maximum memory spilled per hour
Downloading Cluster Utilization Reports Using the Cloudera Manager API
You can download the Cluster Utilization Reports as a JSON file using the Cloudera Manager API. Three new API endpoints have been added.
- Cluster Utilization:http://cloudera.github.io/cm_api/apidocs/v18/path__clusters_-clusterName-_utilization.html
- Impala Utilization: http://cloudera.github.io/cm_api/apidocs/v18/path__clusters_-clusterName-_impalaUtilization.html
- YARN Utilization: http://cloudera.github.io/cm_api/apidocs/v18/path__clusters_-clusterName-_yarnUtilization.html
