Lineage Diagrams
When it comes to making important business decisions, filing financial records, or complying with all manner of regulations, organizations need verifiable data. Public corporations in the United States must be able to prove to the IRS or to the SEC that values supplied in balance sheets and income statements are legitimate, for example. In pharmaceuticals research, data collected over multi-year clinical trials that may be combined with anonymous patient statistics must be able to be traced to data sources.
Cloudera Navigator lineage diagrams are designed to enable this type of verification. Lineage diagrams can reveal the provenance of data entities—the history of the data entity, back to its source with all changes along the way to its present form.
A lineage diagram is a directed graph that shows how data entities are related and how an entity may have changed over its lifetime in the cluster. Cloudera Navigator uses the metadata associated with entities contained in the cluster to render lineage diagrams that can trace data sources back to the column level and show relations and the results of transformations. See Lineage Diagram Icons for details about the line colors, styles, and icons used to render lineage diagrams, some of which are explained in the context of the examples below.
Continue reading:
- Exploring Lineage Diagrams
- Expanding Entities
- Adjusting the Lineage Layout for Readability
- Filtering Lineage Diagrams
- Exploring Hidden Entities in a Lineage Diagram
- Finding Specific Entities in Lineage Diagrams
- Displaying a Template Lineage Diagram
- Displaying an Instance Lineage Diagram
- Displaying the Template Lineage Diagram for an Instance Lineage Diagram
- Using Lineage to Display Table Schema
Exploring Lineage Diagrams
Required Role: Metadata & Lineage Viewer (or Managed & Custom Metadata Editor, or Full Administrator)
Lineage diagrams are accessible in various ways in the Cloudera Navigator console. This example uses Search to first find a specific entity and then display its lineage diagram. Use this approach if you know the name, data type, source type, or another property value for a specific entity. The example uses the Hive sample data warehouse (installed by default) and assumes the following query has been run:
SELECT sample_07.description, sample_07.salary FROM sample_07
WHERE (sample_07.salary > 100000)
ORDER BY sample_07.salary DESC LIMIT 1000
The query returns values from description and salary columns for salaries over 100,000 from the sample_07 table. Because Cloudera Navigator automatically collects metadata from entities, it can render lineage diagrams on any data contained in the cluster, including operations, such as the SELECT query of the example.
- Click the Search tab.
- Click Hive and Operation filters limit the scope of the search.
- Type the word salary or sample_07 to find the query created above.
- Find the returned entity that contains the query and click on it to display its Details page.
- Click the query and then click the Lineage tab to display the lineage diagram.

The columns identified in the select clause use solid directed lines to the source table (shown with the Hive Table icon) and a dashed line to the source column of the where clause (shown with the Operation icon).
Expanding Entities
The example shows how one lineage diagram can expand to another. The first image shows a YARN operation (PigLatin:DefaultJobName) that runs an associated Pig script of the same name (DefaultJobName). The solid lines
represent data flow relationships, from the source file (in the ord_us_gcb_crd_crs-fdr-sears folder) through the script execution, to the destination (in folder tmp137071676). The YARN operation
PigLatin:DefaultJobName is rendered using a dashed (rather than solid) line because it is the starting point for this particular lineage diagram. In lineage diagrams, lines change to the color blue
when they are selected. Containment is signalled using the plus icon:
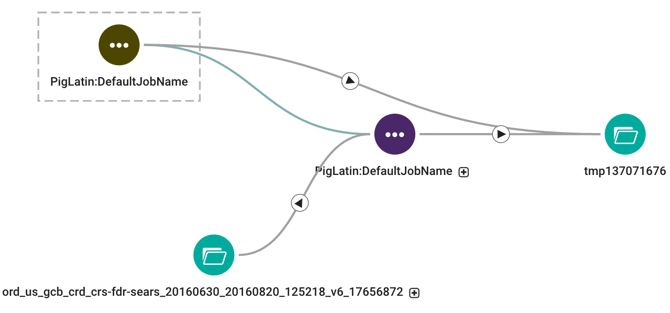
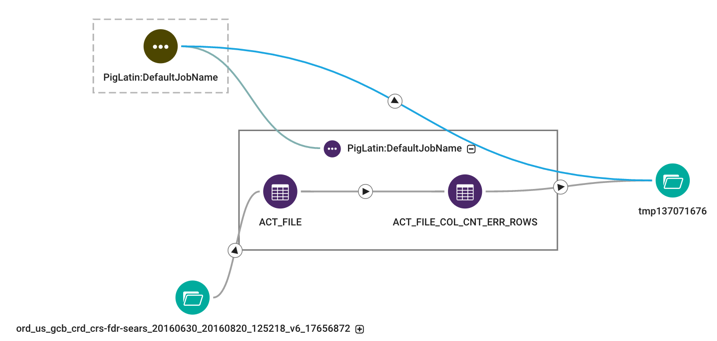
Click the plus icon to expand a parent entity and display child entities. For example, expanding the Pig script reveals the two Pig tables (ACT_FILE, ACT_FILE_COL_CNT_ERR_ROWS)
referenced by the script. The solid directional line between the two tables indicates the data flow relationship between these two tables.
Adjusting the Lineage Layout for Readability
- Click and drag entities outside their parent boxes.
- Use the plus-minus control displayed in the lineage diagram or the mouse scroll wheel to expand and shrink (zoom in, zoom out) the image size
- Relocate the lineage diagram within the pane using click-hold-drag gesture.
Filtering Lineage Diagrams
Lineage diagrams can render faster when filters are applied. Filters can limit or specify the entities displayed.
| Filter | Result |
|---|---|
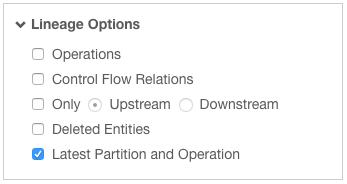
| The Lineage Options default selection applies the Latest Partition and Operation
filter, which displays only the most recent partitions and operations. For example, if Hive partitions are created daily, the filter displays only the latest partition.
|
 |
| Lineage diagram of the sample_09 table filtering deleted items only. |  |
| Control Flow Relations. The operation is collapsed and control flow links are hidden. |  |
| The Only Upstream filter displays only input (upstream) entities and links. The Only Downstream filter displays only output (downstream) entities and links. The operation is collapsed and only upstream (or downstream) entities and links display. The output table is hidden. | 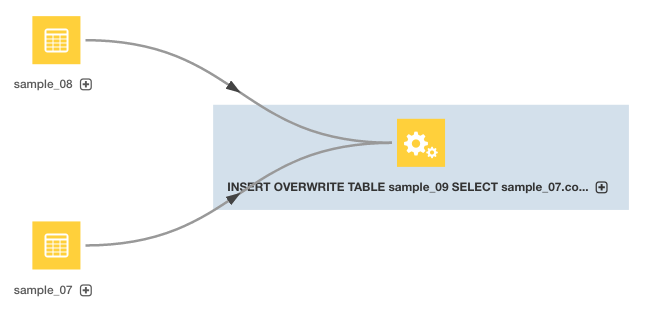 |
| Here, the operation is collapsed and only downstream entities and links are shown. The input tables are hidden. |  |
| The Operations filter collapses operations into green links between entities. | 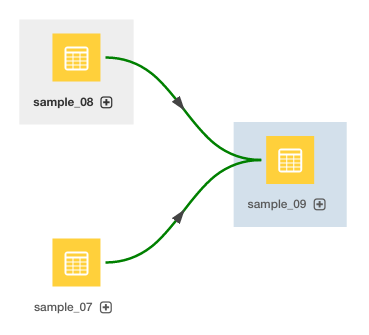 |
| The Deleted Entities filter displays entities that have been deleted but maintains relations to other entities. | 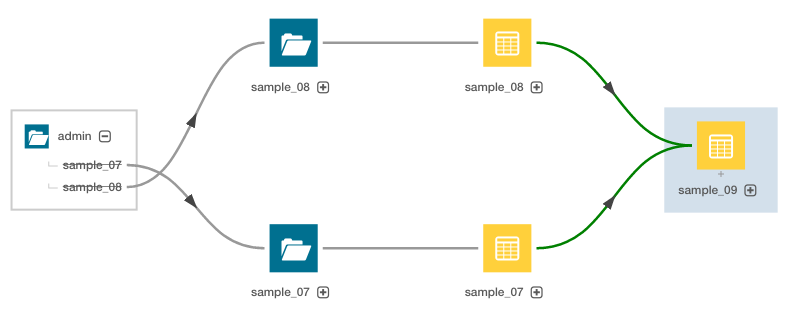 |
Finding Specific Entities in Lineage Diagrams
- In the Search box at the right of the diagram, type an entity name. A list of matching entities displays below the box.
- Click an entity in the list. A blue box is drawn around the entity and its details display in a box below the Search box.
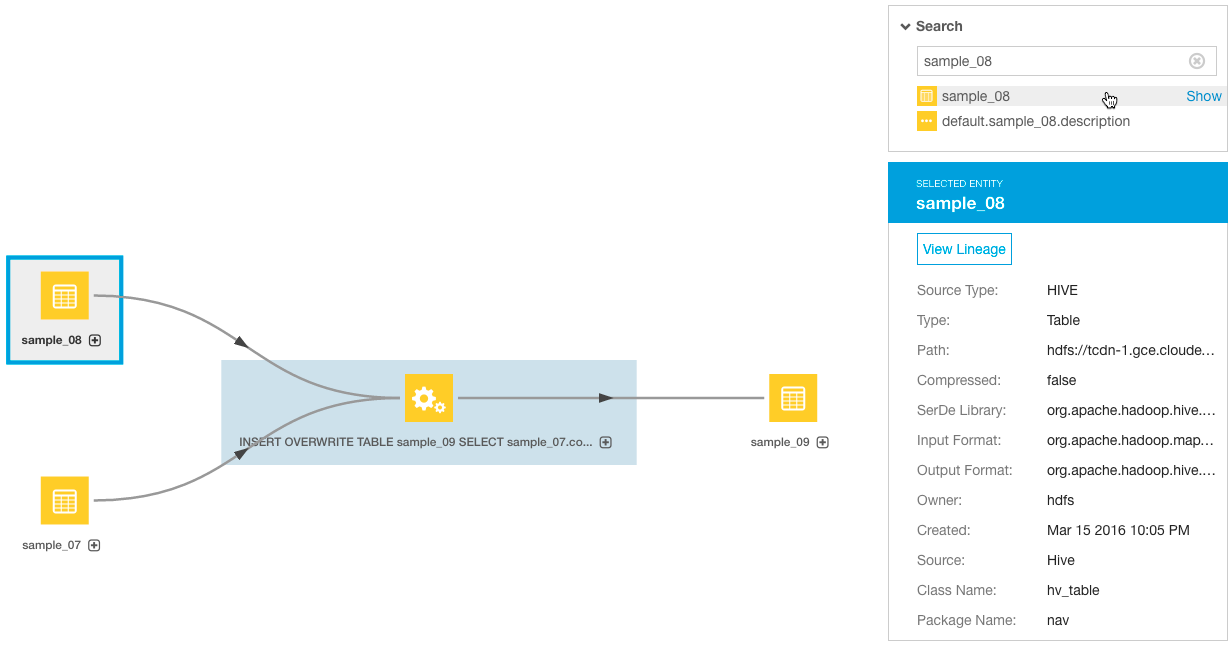
- Click the Show link next to the entity. The selected entity moves to the center of the diagram.
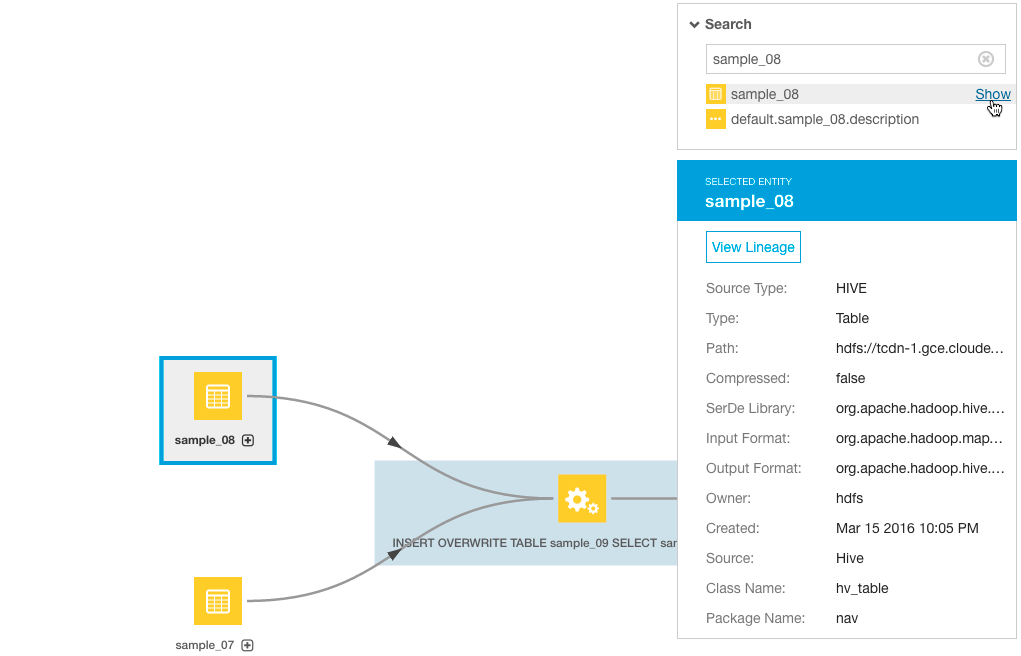
- To view the lineage of the selected entity, click the View Lineage link in the entity details box.
Displaying a Template Lineage Diagram
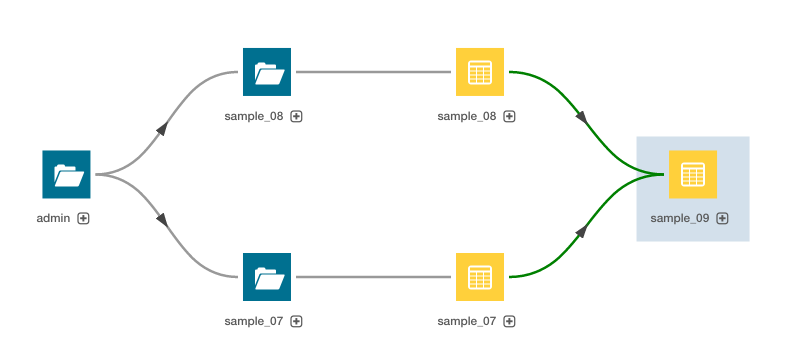
A template lineage diagram contains template entities, such as jobs and queries, that can be instantiated, and the input and output entities to which they are related.
- Perform a metadata search.
- In the list of results, click an entity. The entity Details page displays. For example, when you click the sample_09 result entry:

the Search screen is replaced with a Details page that displays the entity property sheet:
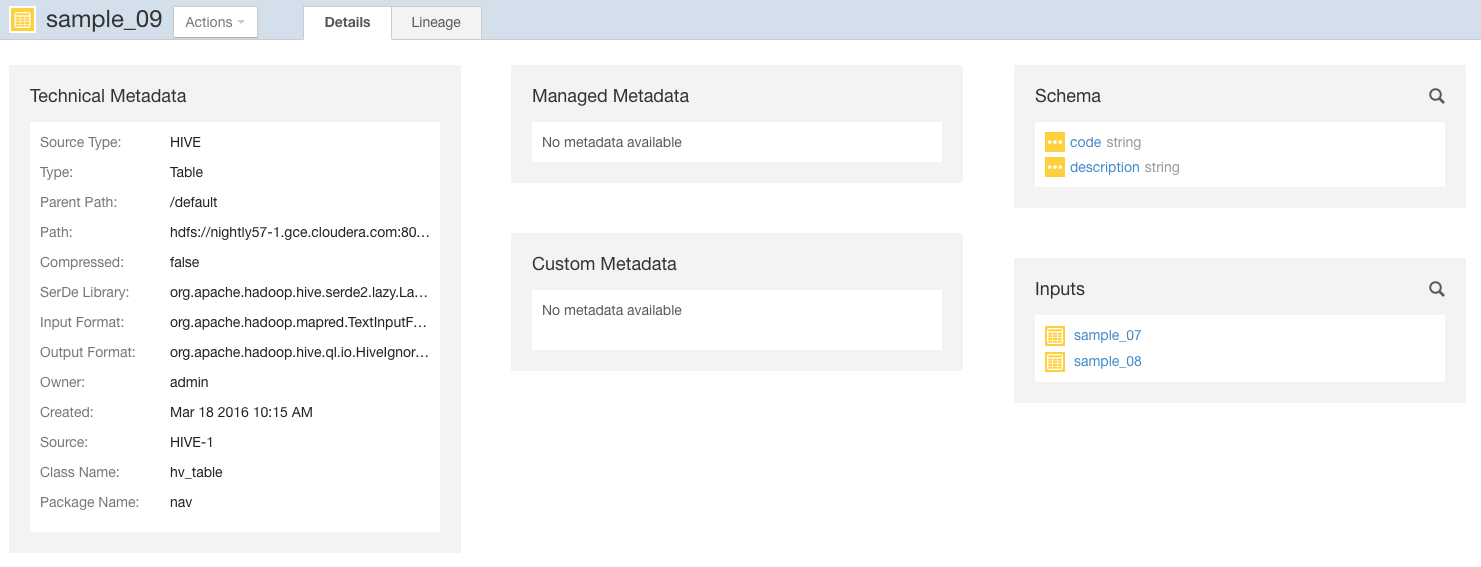
- Click the Lineage tab. For example, clicking the Lineage tab for the sample_09 table displays the following lineage diagram:
Displaying an Instance Lineage Diagram
An instance lineage diagram displays instance entities, such as job and query executions, and the input and output entities to which they are related. To display an instance lineage diagram:
- Perform a search and click a link of type Operation.
- Click a link in the Instances box.
- Click the Lineage tab.

Displaying the Template Lineage Diagram for an Instance Lineage Diagram
To browse from an instance diagram to its template:
- Display an instance lineage diagram.
- Click the Details tab.
- Click the value of the Template property to go to the instance's template.


